Batteries, spares and readiness
UAT 303 UAS Inspection and Maintenance
Lesson
By the end of this module you will be able to
- Track battery capacity fade and predict the cycle at which the retirement threshold is reached
- Compute the number of spares with the Poisson distribution
- Compute fleet availability
- Manage the lifecycle of aircraft and components from receipt to retirement
Why this matters
UAT 321 covered the battery register and the status of each battery. This module works at fleet level: when will this set of batteries wear out, how many spares are needed, and how many drones will be ready tomorrow? The drone knowledge base’s unit on lithium battery safety covers charging, storage, transport, swelling and fire response, which must always be followed. The course case is still the four-drone survey fleet, with hypothetical data.
When does a battery wear out?
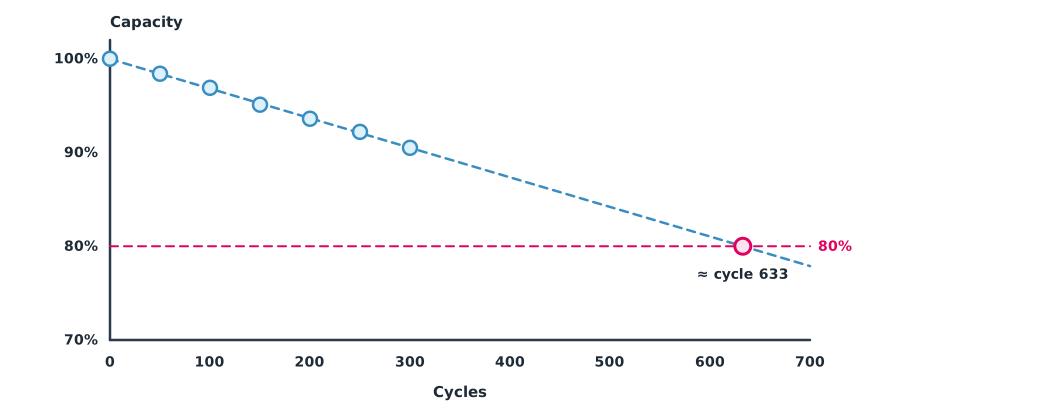
Lithium battery capacity falls with the number of cycles. A widely used end-of-life criterion is 80% of rated capacity; for example, the USABC battery test manual (1996) defines end of life this way, although it was written for electric vehicles. Drone teams should use the battery maker’s criterion first if there is one, and choose a threshold that still leaves enough flight time for the mission plus reserve. The team measures real capacity with a constant-current discharge every 50 cycles and fits a trend to plan purchases ahead, instead of waiting until a battery cannot deliver flight time on an operational day.
Example 1 Predicting the cycle at 80% capacity
import numpy as np

cycles = np.array([0, 50, 100, 150, 200, 250, 300])
capacity = np.array([100, 98.4, 96.9, 95.1, 93.6, 92.2, 90.5])   # % of rated capacity
EOL = 80.0
m, b = np.polyfit(cycles, capacity, 1)
n_eol = (EOL - b) / m
print(f"fade {m * 100:.2f} % per 100 cycles, intercept {b:.1f} %")
print(f"predicted {EOL:.0f}% at about cycle {n_eol:.0f}; about {n_eol - cycles[-1]:.0f} cycles left")
flights_per_week = 12
print(f"at {flights_per_week} cycles per week: about {(n_eol - cycles[-1]) / flights_per_week:.0f} weeks to order replacements")
fade -3.16 % per 100 cycles, intercept 100.0 %
predicted 80% at about cycle 633; about 333 cycles left
at 12 cycles per week: about 28 weeks to order replacementsBeware that capacity fade is often not linear over the whole life; some cells fade faster near the end. The prediction is for planning, but capacity must be remeasured on schedule, and a battery must be retired at once if it swells, is physically damaged or has widely differing cells, whatever its remaining capacity.
How many spares?
If components fail randomly at a constant rate, the number of failures in a period follows the Poisson distribution, with mean equal to the number of components in use times the operating hours divided by the MTBF. This approach is used in planning spares for the International Space Station, where the probability that spares are enough is called the probability of sufficiency (Owens and de Weck, 2018). The team chooses a stock so that the probability of demand not exceeding is above the target. Parts replaced on schedule (Module 1) are counted separately, because their use is known in advance.
Example 2 ESC spares for one quarter
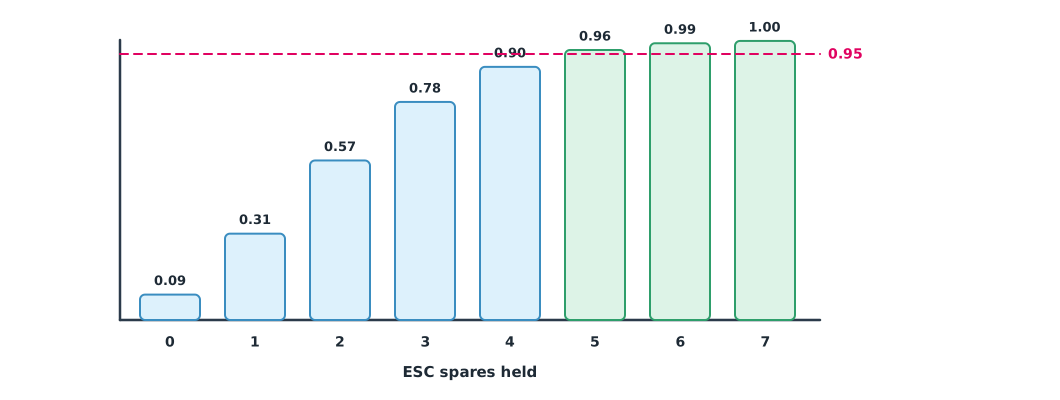
The four-drone fleet has 16 ESCs in total and flies 300 hours per quarter. The ESC MTBF is 2,000 hours (hypothetical). The target is at least a 95% chance of no stock-out.
import math

N, HOURS, MTBF, TARGET = 16, 300, 2000, 0.95
lam = N * HOURS / MTBF
cum = 0.0
for k in range(12):
    cum += math.exp(-lam) * lam ** k / math.factorial(k)
    print(f"stock {k}: P(demand <= {k}) = {cum:.3f}")
    if cum >= TARGET:
        break
print(f"expected failures {lam:.1f}; keep {k} spares for >= {TARGET:.0%}")

mtbf_uav, mttr = 120, 16                       # hours, per aircraft
a = mtbf_uav / (mtbf_uav + mttr)
print(f"availability per aircraft {a:.3f}; expected aircraft ready out of 4: {4 * a:.1f}")
p_all = a ** 4
p_3plus = p_all + 4 * a ** 3 * (1 - a)
print(f"P(all 4 ready) {p_all:.2f}, P(at least 3 ready) {p_3plus:.2f}")
stock 0: P(demand <= 0) = 0.091
stock 1: P(demand <= 1) = 0.308
stock 2: P(demand <= 2) = 0.570
stock 3: P(demand <= 3) = 0.779
stock 4: P(demand <= 4) = 0.904
stock 5: P(demand <= 5) = 0.964
expected failures 2.4; keep 5 spares for >= 95%
availability per aircraft 0.882; expected aircraft ready out of 4: 3.5
P(all 4 ready) 0.61, P(at least 3 ready) 0.93Holding the mean (about 2–3 units) would run out too often; 5 are needed to reach 95%. For fleet readiness, if a mission needs three drones at once, the chance of having at least three ready matters more than each aircraft’s average availability. Reducing repair time (MTTR) with spares on hand and trained technicians raises availability as much as improving reliability does.
The aircraft lifecycle
Lifecycle management under continued-airworthiness practice runs from receipt (acceptance inspection, recording the serial numbers of the aircraft and key components) through operation (logging flight hours, battery cycles and repairs) and modification (updating firmware and components under configuration control) to retirement (removing reusable parts with their history, disposing of batteries safely and closing the register). The data from every stage lets the next decision use real numbers, such as the fleet’s own MTBF instead of the maker’s.
Module lab
Lab: a readiness plan for the training fleet
- Measure the real capacity of at least four programme batteries with a charger that measures capacity on discharge, and record it in the register
- Predict the cycle at the retirement threshold with Example 1 and write a purchase plan
- Count flight hours and component failures from real records and compute spares with Example 2
- Compute fleet availability from the programme’s real MTBF and MTTR
- Write a one-page retirement procedure for batteries and aircraft
Common mistakes
Watch out
- Using batteries until they cannot deliver flight time instead of predicting ahead
- Extending a linear trend far beyond the data
- Stocking spares equal to the mean demand
- Looking only at each aircraft’s average availability, not how many are ready at once
- Retiring aircraft without keeping component histories
Summary
- Track capacity periodically and predict the cycle at the retirement threshold, but remeasure, since fade is not always linear
- Random failures follow the Poisson distribution, and spares must exceed the mean to reach the probability target
- Availability (NASA RCM Guide, 2008), and fleet readiness depends on how many aircraft are ready at once
- The lifecycle starts at receipt and ends at retirement, with records at every stage
Check your understanding
- Capacity falls 0.04% per cycle from 100%. At which cycle does it reach 80%?
- Ten components run 200 hours with an MTBF of 1,000 hours. What is the mean number of failures ?
- With , what is the probability that nothing fails?
- MTBF 100 hours and MTTR 25 hours. What is the availability?
- Why should spares exceed the mean demand?
Answers
- cycles
- Stocking the mean gives a high chance that demand exceeds the stock; a margin is needed to reach the probability target
Key formulas
| Cycle at the threshold (linear trend) | |
| Poisson distribution | |
| Availability |
Key references
- United States Advanced Battery Consortium. (1996). Electric vehicle battery test procedures manual (Rev. 2). link
- Owens, A., & de Weck, O. (2018). International Space Station operational experience and its impacts on future mission supportability (ICES-2018-198). 48th International Conference on Environmental Systems. link
- National Aeronautics and Space Administration. (2008). Reliability-centered maintenance guide for facilities and collateral equipment. link
- ASTM International. (2019). Standard specification for continued airworthiness of lightweight unmanned aircraft systems (ASTM F2909-19). link
- ArduPilot Dev Team. Onboard message log messages. ArduPilot Copter documentation. link
Further reading
Study the assigned knowledge units in advance, review media and take the module quiz
In class / field
Lab or field practice from worksheets with a safety checklist
Learning evidence: Checked worksheets and quiz results