Evaluating perception reliability
UAT 307 Computer Vision and Perception Technology
Lesson
By the end of this module you will be able to
- Compute absolute trajectory error (ATE) after aligning trajectories with Umeyama's method
- Explain the difference between ATE and RPE and use each for the right question
- Find periods when perception lost tracking from timestamps
- Identify limitations of RGB and thermal images that cause perception errors
Why this matters
A perception system that looks good in a demo video can fail in real work. The drone knowledge base’s unit on how to know whether a position is trustworthy teaches reading errors, alignment and tracking loss, with the conditions that make comparisons fair. Its synthetic navigation-data exercise starts from self-generated timestamps and trajectories, and its unit on RGB and thermal limitations warns to check data type, viewing angle, occlusion and shadow before reading meaning into image colours.
ATE and alignment
A trajectory from visual navigation usually lives in its own coordinate frame, rotated and shifted from the reference frame. Comparing directly gives an inflated error. Sturm et al. (2012) define ATE (absolute trajectory error) as computed after aligning the two trajectories with the best transformation, which can be found with Umeyama’s (1991) least-squares method. RPE (relative pose error) measures the error of motion over short intervals and therefore shows accumulated drift. ATE answers “how close is the overall path?”, and RPE answers “how fast does it drift?”
Example 1 ATE before and after alignment
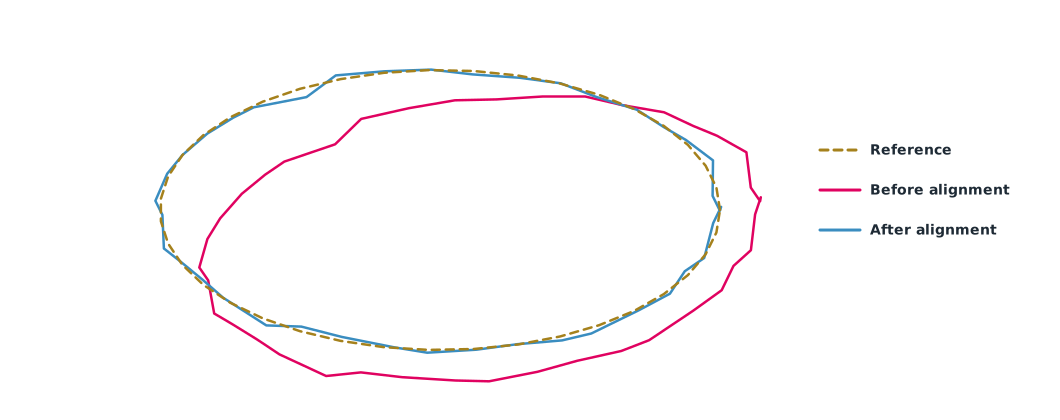
A reference ellipse and an estimated trajectory rotated by 8°, shifted by (3, −2) m and with 0.3 m of noise (simulated data).
import math
import numpy as np

t = np.linspace(0, 2 * np.pi, 40)
gt = np.c_[20 * np.cos(t), 10 * np.sin(t)]                           # m
th = math.radians(8)
rot = np.array([[math.cos(th), -math.sin(th)], [math.sin(th), math.cos(th)]])
est = gt @ rot.T + np.array([3.0, -2.0]) + np.random.default_rng(2).normal(0, 0.3, gt.shape)

raw = np.sqrt(np.mean(np.sum((est - gt) ** 2, axis=1)))
mu_e, mu_g = est.mean(0), gt.mean(0)
U, _, Vt = np.linalg.svd((gt - mu_g).T @ (est - mu_e))               # Umeyama without scale
D = np.diag([1, np.sign(np.linalg.det(U @ Vt))])
R = U @ D @ Vt
aligned = (est - mu_e) @ R.T + mu_g
ate = np.sqrt(np.mean(np.sum((aligned - gt) ** 2, axis=1)))
print(f"error without alignment {raw:.2f} m")
print(f"ATE after alignment {ate:.2f} m (rotation found {math.degrees(math.atan2(R[1, 0], R[0, 0])):.1f} deg)")
error without alignment 4.22 m
ATE after alignment 0.42 m (rotation found -7.7 deg)Before alignment, most of the several metres of error comes from the frame difference. After alignment, it falls to near the noise level, which is the real error in the shape of the path. Reporting ATE must state which alignment was used (rotation and translation, or scale as well), because scale alignment hides the single-camera scale problem from Module 4.
Periods of lost tracking
Visual perception loses tracking when images lack features, for example over water or uniform grass, in direct sunlight, or when moving so fast that images blur. During these periods the system may output nothing, or output values drifting on the IMU. Finding these periods from output timestamps is an immediate first check.
Example 2 Periods without output
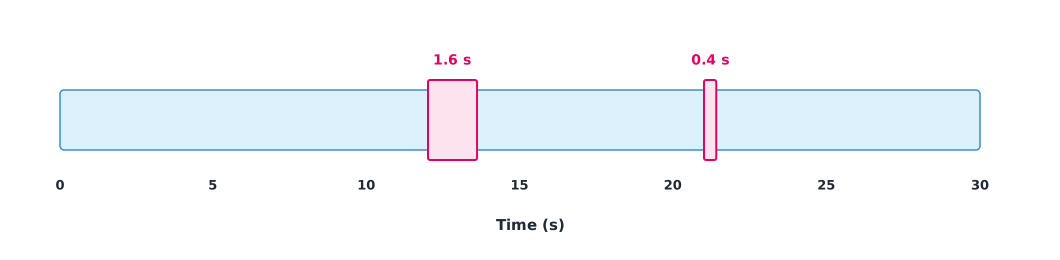
The system outputs at 20 Hz throughout a 30-second flight; the team treats gaps over 0.2 seconds as lost tracking (simulated data).
import numpy as np

ts = np.arange(0, 30, 0.05)
ts = ts[~(((ts > 12.0) & (ts < 13.6)) | ((ts > 21.0) & (ts < 21.4)))]   # missing periods
gaps = np.diff(ts)
lost = gaps > 0.2
print(f"{ts.size} outputs, {lost.sum()} gaps over 0.2 s")
for start, g in zip(ts[:-1][lost], gaps[lost]):
    print(f"  lost at t = {start:.2f} s for {g:.2f} s")
print(f"time without tracking {gaps[lost].sum():.2f} s = {gaps[lost].sum() / 30:.1%} of the flight, longest {gaps.max():.2f} s")
562 outputs, 2 gaps over 0.2 s
lost at t = 12.00 s for 1.60 s
lost at t = 21.00 s for 0.40 s
time without tracking 2.00 s = 6.7% of the flight, longest 1.60 sThe longest gap, about 1.6 seconds, is a dangerous period if the drone relies on visual position alone. Look at the recorded images for that period to find the cause, and define what the system must do when tracking is lost for longer than acceptable, such as dropping to a mode that does not need position, or holding position and waiting.
Limitations of RGB and thermal images
RGB images fail in darkness, fog and glare. Thermal images see in the dark but show apparent temperature, which depends on surface emissivity; shiny metal reflects heat from other objects, and the colours in a thermal image are an adjustable palette, not real colours. Before interpreting an image, know whether it is radiometric and how it was set.
Module lab
Lab: fair evaluation of perception
- Create synthetic reference and estimated trajectories and try Example 1 with different rotations and shifts
- Use the data recorded in Module 4 to compute ATE after alignment and RPE over 1-second intervals
- Find lost-tracking periods with Example 2 and look at the images for those periods to find the cause
- Fly over different surfaces (grass, road, water) and compare the share of time without tracking
- Write the operating conditions and limitations of the team’s perception system
Common mistakes
Watch out
- Comparing trajectories without alignment and concluding the system is poor
- Aligning with scale and hiding the scale problem
- Reporting only ATE when the question is accumulated drift
- Looking only at averages and not at lost-tracking periods
- Reading thermal colours as true temperature without knowing emissivity
Summary
- ATE is computed after alignment with Umeyama’s method, and the alignment type must be stated
- ATE describes overall path accuracy; RPE describes short-term drift
- Lost-tracking periods can be found from timestamp gaps and need a defined response
- RGB and thermal images each have limitations; know the data type before interpreting
Check your understanding
- Why align before computing ATE?
- How do ATE and RPE differ?
- Outputs at 20 Hz have a 1.2 s gap. About how many outputs are missing?
- Why should scale not be adjusted when aligning the output of a camera-plus-IMU system?
- Why might a thermal image of a metal roof show the wrong temperature?
Answers
- The two trajectories are in different frames; without alignment the error includes the frame difference
- ATE measures overall path accuracy; RPE measures short-term motion error, i.e. drift
- About outputs (about 23, since the gap is counted from the previous output)
- That system should know scale itself; adjusting it hides scale errors
- Shiny metal has low emissivity and reflects heat from other objects
Key formulas
| ATE (RMSE after alignment) | |
| Share of time without tracking |
Key references
- Sturm, J., Engelhard, N., Endres, F., Burgard, W., & Cremers, D. (2012). A benchmark for the evaluation of RGB-D SLAM systems. In 2012 IEEE/RSJ International Conference on Intelligent Robots and Systems (pp. 573–580). link
- Umeyama, S. (1991). Least-squares estimation of transformation parameters between two point patterns. IEEE Transactions on Pattern Analysis and Machine Intelligence, 13(4), 376–380. link
- Szeliski, R. (2022). Computer vision: Algorithms and applications (2nd ed.). Springer. link
- Corke, P. (2023). Robotics, vision and control: Fundamental algorithms in Python. Springer. link
Further reading
Study the assigned knowledge units in advance, review media and take the module quiz
How to know an estimated position is reliable
Exercise: reading synthetic navigation data
Limitations of RGB and thermal imagery
In class / field
Lab or field practice from worksheets with a safety checklist
Learning evidence: Checked worksheets and quiz results