Maintenance programmes
UAT 303 UAS Inspection and Maintenance
Lesson
By the end of this module you will be able to
- Explain reliability-centred maintenance (RCM) and component failure patterns
- Estimate Weibull parameters from component failure hours and interpret β
- Compute the age-replacement interval that minimises cost per hour
- Choose between scheduled replacement, condition monitoring and run-to-failure
Why this matters
UAT 321 taught how to build a maintenance programme from the manufacturer’s due items. This course asks the next question: what should those intervals be, and should parts be replaced on schedule at all? The course case is a fleet of four survey drones at one agency, with two years of repair records. The drone knowledge base’s unit on maintenance programmes covers scheduled inspections, flight hours, component life and logbooks, and ASTM F2909-19 addresses the continued airworthiness of lightweight UAS, covering the aircraft, control station, C2 link and launch and recovery equipment. The numbers in this module are hypothetical.
Reliability-centred maintenance
The Reliability-Centered Maintenance report by Nowlan and Heap (1978), which changed how United Airlines maintained its aircraft, found that most components do not fail because of age. NASA’s RCM guide (2008) summarises several studies: random failures make up about 77–92% and age-related failures only 8–23%. The key conclusion is that scheduled replacement only works for components that wear out with age; components that fail randomly should be monitored for condition instead. SAE JA1011 sets the criteria a process must meet to be called RCM.
Failure patterns and Weibull
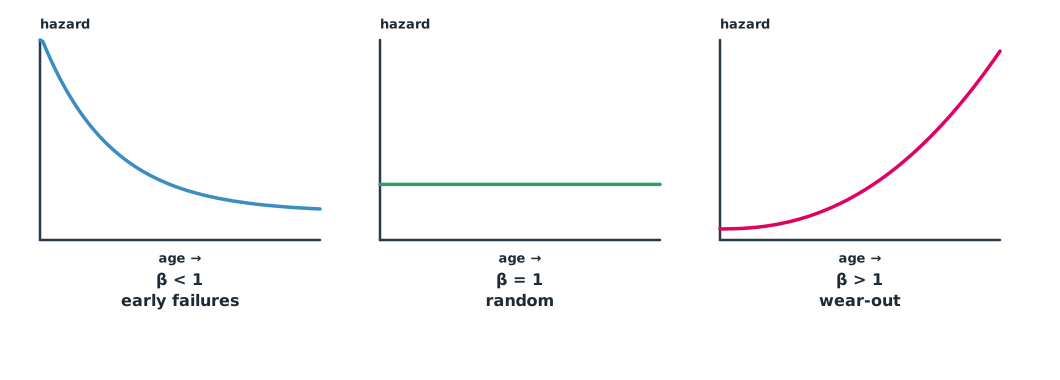
The Weibull distribution describes many component lives through a shape parameter and a characteristic life . Following the NIST statistics handbook, means a decreasing failure rate (early failures), a constant rate (random failures), and an increasing rate (wear-out). Estimating from real data therefore tells you which strategy to use.
Example 1 Fitting a Weibull to motor failures
Ten motors in the fleet failed at the flight hours below. Use regression on Weibull paper: sort the data, estimate the failed fraction with Bernard’s median rank, and linearise as .
import math
import numpy as np

hours = np.array([310, 420, 480, 530, 600, 640, 700, 760, 830, 950.])   # flight hours at failure, sorted
n = len(hours)
F = (np.arange(1, n + 1) - 0.3) / (n + 0.4)      # median rank (Bernard)
x, y = np.log(hours), np.log(-np.log(1 - F))
beta, a = np.polyfit(x, y, 1)
eta = math.exp(-a / beta)
r2 = np.corrcoef(x, y)[0, 1] ** 2
mean_life = eta * math.gamma(1 + 1 / beta)
print(f"beta {beta:.2f}, eta {eta:.0f} h, R^2 {r2:.3f}, mean life {mean_life:.0f} h")
print("wear-out: planned replacement can help" if beta > 1 else "not wear-out: use condition monitoring")
beta 3.30, eta 694 h, R^2 0.999, mean life 623 h
wear-out: planned replacement can helpis clearly above 1, so this fleet’s motors wear out with age and scheduled replacement makes sense. Ten data points give a fairly uncertain estimate, and real data usually includes motors that have not yet failed (censored data), which needs an estimation method that handles it, such as maximum likelihood.
The most economical interval
If a motor is replaced as planned at age , or on failure if it fails before , each cycle of use ends with cost (planned replacement) with probability , or (in-flight failure including the damage that follows) with probability . The mean cycle length is . The cost per hour is therefore the expected cost per cycle divided by the expected cycle length.
Example 2 How often should motors be replaced?
A planned replacement costs 1,500 THB per motor. If a motor fails in flight, the total damage averages 30,000 THB (hypothetical). Use and from Example 1.
import math
import numpy as np

BETA, ETA = 3.30, 694.4                          # from Example 1
CP, CF = 1500, 30000                             # THB

def R(t):
    return math.exp(-(t / ETA) ** BETA)

def cost_rate(T):
    ts = np.linspace(0, T, 2001)
    return (CP * R(T) + CF * (1 - R(T))) / np.trapezoid([R(u) for u in ts], ts)

best = min(range(50, 901, 10), key=cost_rate)
mean_life = ETA * math.gamma(1 + 1 / BETA)
print(f"best interval {best} h: {cost_rate(best):.2f} THB/h, R({best}) = {R(best):.3f}")
for T in (150, 300, 400):
    print(f"interval {T} h: {cost_rate(T):.2f} THB/h")
print(f"run to failure: {CF / mean_life:.2f} THB/h")
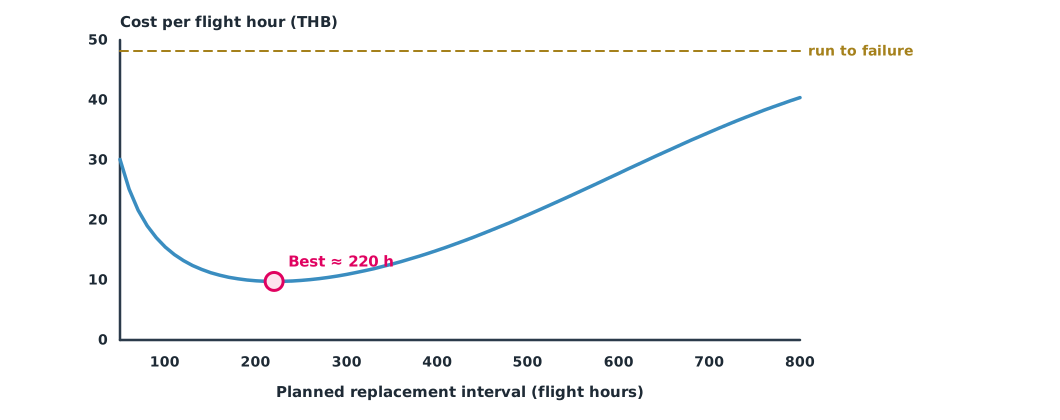
best interval 220 h: 9.75 THB/h, R(220) = 0.978
interval 150 h: 11.22 THB/h
interval 300 h: 10.93 THB/h
interval 400 h: 14.94 THB/h
run to failure: 48.16 THB/hReplacing at about 220 hours costs several times less than running to failure, because in-flight failure damage is far more expensive than the motor itself. Replacing too early throws away useful life; too late risks in-flight failure. The curve is fairly flat around its minimum, so the team can choose an interval that matches routine inspections, such as 200 hours, at only a little extra cost.
Choosing a strategy
- Scheduled replacement when a component clearly wears out () and failure has serious consequences
- Condition monitoring when there is a measurable warning before failure, such as vibration, battery internal resistance or motor temperature
- Run to failure when failure does not affect safety and replacement is cheap, such as status lights
- If failure affects safety and no strategy works, redesign, for example by adding redundancy
Module lab
Lab: reviewing the maintenance programme with data
- Collect the component replacement history of the training drones from the logbooks (at least propellers, motors and batteries)
- Fit a Weibull to components with enough data using Example 1, and identify which wear out with age
- Find the cost of planned replacement and of failure, then compute the interval with Example 2
- Choose a strategy for each component with reasons
- Compare with the manufacturer’s intervals; if they differ, present the evidence to the instructor, and never extend intervals beyond the manual on your own
Common mistakes
Watch out
- Replacing every part on schedule even when it fails randomly
- Fitting a Weibull to very little data and trusting the decimals
- Leaving out components that have not failed yet
- Counting the cost of failure as the part price, forgetting the damage that follows
- Extending intervals beyond the manufacturer’s manual without approval
Summary
- RCM found that most components fail randomly; scheduled replacement only works for parts that wear out with age
- Weibull shows the failure pattern: below 1 early failures, 1 random, above 1 wear-out
- The most economical interval minimises the expected cost per cycle divided by the expected cycle length
- Choose a strategy from the failure pattern and its consequences
Check your understanding
- What does tell you about a component?
- h and . What is the reliability at 250 h?
- With 5 data points, what is the median rank of the first?
- Why is the cost of an in-flight failure usually much higher than the part price?
- Which strategy suits a component that fails randomly?
Answers
- The failure rate falls over time, meaning early failures, for example from manufacturing or installation errors; scheduled replacement does not help
- It includes damage to the aircraft and payload and the effect on the mission
- Condition monitoring, or run to failure if safety is not affected
Key formulas
| Weibull reliability | |
| Median rank (Bernard) | |
| Cost per hour with replacement at age T |
Key references
- Nowlan, F. S., & Heap, H. F. (1978). Reliability-centered maintenance (AD-A066579). United Airlines for the Office of the Assistant Secretary of Defense. link
- National Aeronautics and Space Administration. (2008). Reliability-centered maintenance guide for facilities and collateral equipment. link
- SAE International. (2009). Evaluation criteria for reliability-centered maintenance (RCM) processes (SAE JA1011_200908). link
- NIST/SEMATECH. Weibull (section 8.1.6.2). e-Handbook of statistical methods. link
- NIST/SEMATECH. Weibull distribution (section 1.3.6.6.8). e-Handbook of statistical methods. link
- ASTM International. (2019). Standard specification for continued airworthiness of lightweight unmanned aircraft systems (ASTM F2909-19). link
Further reading
Study the assigned knowledge units in advance, review media and take the module quiz
In class / field
Lab or field practice from worksheets with a safety checklist
Learning evidence: Checked worksheets and quiz results