Diagnosis from logs
UAT 303 UAS Inspection and Maintenance
Lesson
By the end of this module you will be able to
- Form several hypotheses from symptoms and choose log data that separates them
- Use a Fourier transform (FFT) of acceleration data to separate propeller imbalance from normal vibration
- Compare redundant sensors to find a faulty one
- Write a diagnosis that separates evidence from assumptions
Why this matters
UAT 321 covered the diagnosis cycle, internal resistance from logs and motor imbalance from output values. This module adds two tools that senior technicians use: looking at vibration in the frequency domain and comparing redundant sensors. The drone knowledge base’s unit on diagnosis from symptoms and logs warns that a log is evidence of what the system recorded, not the whole truth; an abnormal signal may come from the measurement, the wiring or another subsystem. Diagnosis must therefore start from several hypotheses. The course case is an agency’s fleet of four survey drones; the example data is simulated.
From symptoms to hypotheses
The symptom “UAV 3 vibrates more after a hard landing” has several possible causes: a chipped or unbalanced propeller, a bent motor shaft, a loose flight controller damping mount, or a cracked frame causing resonance. Each hypothesis leaves a different trace in the data. Imbalance in a rotating part produces a force at once-per-revolution frequency (), while each blade passing an arm produces vibration at the blade-pass frequency (), which exists even on a healthy drone. The ArduPilot harmonic notch and in-flight FFT documentation explains that multicopter vibration comes from the motor rotation frequency and its harmonics. The Fourier transform (FFT) splits the acceleration signal into components by frequency, showing where vibration has grown. The frequency resolution equals one divided by the length of the data.
Example 1 Separating imbalance with an FFT
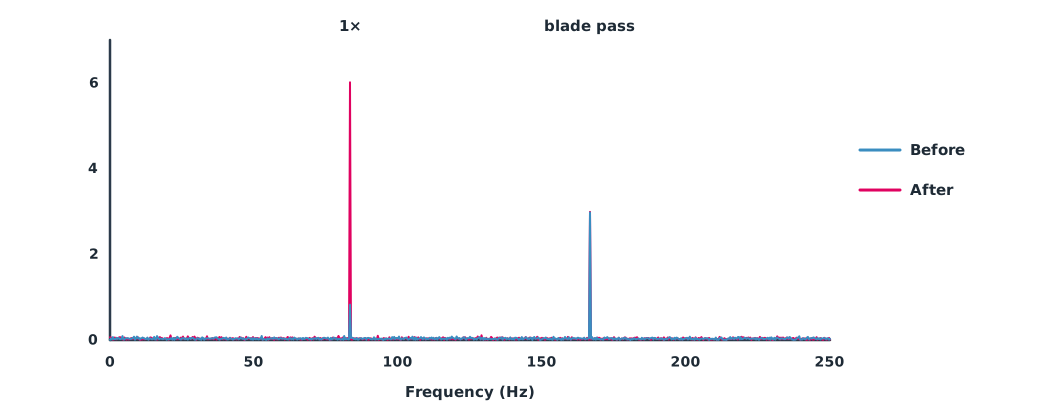
Simulated X-axis acceleration sampled at 1,000 Hz for 3 seconds while hovering at 5,000 rpm with 2-blade propellers, before and after a hard landing.
import numpy as np

FS, T = 1000, 3.0                              # Hz, s
RPM, BLADES = 5000, 2
f1 = RPM / 60
t = np.arange(0, T, 1 / FS)
rng = np.random.default_rng(7)

def accel(a_1x):                               # m/s², 1x component from imbalance
    return a_1x * np.sin(2 * np.pi * f1 * t) + 3.0 * np.sin(2 * np.pi * BLADES * f1 * t) + rng.normal(0, 1.0, t.size)

print(f"1x = {f1:.1f} Hz, blade pass = {BLADES * f1:.1f} Hz, resolution = {1 / T:.2f} Hz")
for name, a in (("before", 0.8), ("after", 6.0)):
    x = accel(a)
    amp = np.abs(np.fft.rfft(x)) * 2 / x.size
    f = np.fft.rfftfreq(x.size, 1 / FS)
    k1, kb = np.argmin(abs(f - f1)), np.argmin(abs(f - BLADES * f1))
    print(f"{name:<6} peak at {f[np.argmax(amp)]:.1f} Hz | 1x {amp[k1]:.2f} | blade pass {amp[kb]:.2f} | 1x/blade {amp[k1] / amp[kb]:.2f}")
1x = 83.3 Hz, blade pass = 166.7 Hz, resolution = 0.33 Hz
before peak at 166.7 Hz | 1x 0.81 | blade pass 2.99 | 1x/blade 0.27
after peak at 83.3 Hz | 1x 6.02 | blade pass 2.97 | 1x/blade 2.03Before the hard landing, the largest peak is at the blade-pass frequency, as expected. After it, the peak has grown several times to become the largest, while the blade-pass peak has barely changed. This pattern points to imbalance in a rotating part (a chipped propeller or bent shaft) rather than a loose damping mount, which usually raises vibration at all frequencies. In real data the four motors turn at slightly different speeds, so the peaks are broader, and finding which motor is at fault takes a physical inspection.
Comparing redundant sensors
Newer flight controllers carry two or three IMUs, and many aircraft have more than one compass. ArduPilot compares redundant sensors in its pre-arm checks, for example reporting “Gyros inconsistent” when two gyros differ by 5 deg/s or more, and “Accels inconsistent” when accelerometers differ by 0.75 m/s². Maintenance technicians can apply the same idea more finely, to catch faults that do not yet reach the no-fly threshold. If three sensors measure the same thing, the one that differs most from the other two is the first suspect; if only two disagree, you only know one of them is wrong and need more evidence.
Example 2 Finding a faulty IMU with the median
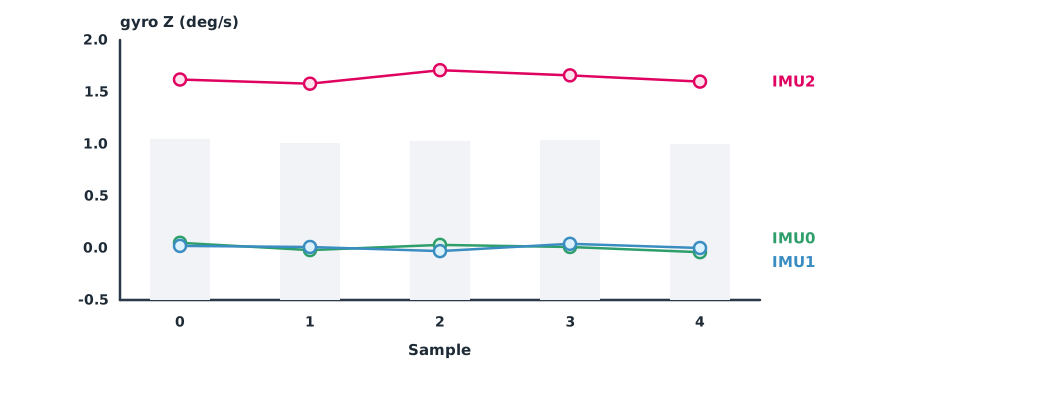
Z-axis rotation rates (deg/s) from three IMUs with the drone stationary on the ground over 5 samples. The team treats a difference from the median of more than 1.0 deg/s as abnormal (simulated values).
import statistics as st

gyro_z = {                                     # deg/s while stationary
    "IMU0": [0.05, -0.02, 0.03, 0.01, -0.04],
    "IMU1": [0.02, 0.01, -0.03, 0.04, 0.00],
    "IMU2": [1.62, 1.58, 1.71, 1.66, 1.60],
}
LIMIT = 1.0
n = len(next(iter(gyro_z.values())))
for k in range(n):
    med = st.median(v[k] for v in gyro_z.values())
    bad = [name for name, v in gyro_z.items() if abs(v[k] - med) > LIMIT]
    print(f"sample {k}: median {med:+.2f} deg/s, outliers {bad or 'none'}")
bias = {name: st.mean(v) for name, v in gyro_z.items()}
print("mean while stationary:", {k: round(v, 2) for k, v in bias.items()})
sample 0: median +0.05 deg/s, outliers ['IMU2']
sample 1: median +0.01 deg/s, outliers ['IMU2']
sample 2: median +0.03 deg/s, outliers ['IMU2']
sample 3: median +0.04 deg/s, outliers ['IMU2']
sample 4: median +0.00 deg/s, outliers ['IMU2']
mean while stationary: {'IMU0': 0.01, 'IMU1': 0.01, 'IMU2': 1.63}IMU2 has a constant offset of about 1.6 deg/s even though the drone is still, while the other two are near zero. A 1.6 deg/s difference is below the 5 deg/s pre-arm threshold, so the aircraft arms and flies normally; passing pre-arm does not mean the sensors are healthy. The result says IMU2 is wrong but not why: it could be an old calibration, temperature or impact damage. Recalibrate and test again, and if it is still wrong, replace the board or disable that IMU according to the manual.
Writing the diagnosis
A good diagnosis separates three parts clearly: evidence (log data, visual inspection, measurements), conclusion (the hypothesis best supported by the evidence, and the hypotheses ruled out with reasons), and confirmation (the post-repair test that will prove the fix addressed the cause, covered in Module 4). Never write an assumption as if it were a fact.
Module lab
Lab: diagnosis from a real log
- Download a hover log from a training drone and view its vibration spectrum in ArduPilot WebTools (FilterReview)
- Stick a small piece of tape near one blade tip under the instructor’s supervision, hover again, and compare the spectrum with Example 1
- Extract every IMU with the drone stationary and compare them with Example 2
- Write a one-page diagnosis separating evidence, conclusion and confirmation
- Remove the tape and fly to confirm the spectrum returns to normal
Common mistakes
Watch out
- Believing the first hypothesis that comes to mind
- Looking only at total vibration and not at which frequency it is at
- Using data that is too short to resolve separate peaks
- Deciding which of two disagreeing sensors is wrong without more evidence
- Writing assumptions as facts
Summary
- Imbalance in a rotating part stands out at , while the blade-pass frequency is present on a healthy drone
- FFT frequency resolution is , so longer data separates peaks more finely
- Three sensors give a median that identifies the faulty one; two only show that one is wrong
- A diagnosis separates evidence, conclusion and confirmation
Check your understanding
- What is the frequency of a motor at 6,600 rpm?
- What is the blade-pass frequency of a 3-blade propeller at 6,600 rpm?
- How long must data be recorded for a frequency resolution of 0.25 Hz?
- Three IMUs read 0.02, 0.05 and 1.40 deg/s. Which is abnormal with a 1.0 deg/s limit from the median?
- Why is a log not the whole truth?
Answers
- Hz
- Hz
- seconds
- The one reading 1.40 deg/s, which is 1.35 deg/s from the median of 0.05
- A log records what sensors measured and what the system calculated, which may be wrong because of the measurement, the wiring or another subsystem
Key formulas
| Motor rotation and blade-pass frequencies | |
| FFT frequency resolution |
Key references
- ArduPilot Dev Team. Managing gyro noise with the dynamic harmonic notch filters. ArduPilot Copter documentation. link
- ArduPilot Dev Team. In-flight FFT. ArduPilot Copter documentation. link
- ArduPilot Dev Team. Measuring vibration. ArduPilot Copter documentation. link
- ArduPilot Dev Team. Onboard message log messages. ArduPilot Copter documentation. link
- ArduPilot Dev Team. Pre-arm safety checks. ArduPilot Copter documentation. link
Further reading
Study the assigned knowledge units in advance, review media and take the module quiz
Diagnosing from symptoms and logs
Analysing filters from a flight log
ArduPilot WebTools
In class / field
Lab or field practice from worksheets with a safety checklist
Learning evidence: Checked worksheets and quiz results