Fault diagnosis
UAT 321 Unmanned Aircraft Systems Installation, Integration, Inspection and Maintenance Laboratory
Lesson
By the end of this module you will be able to
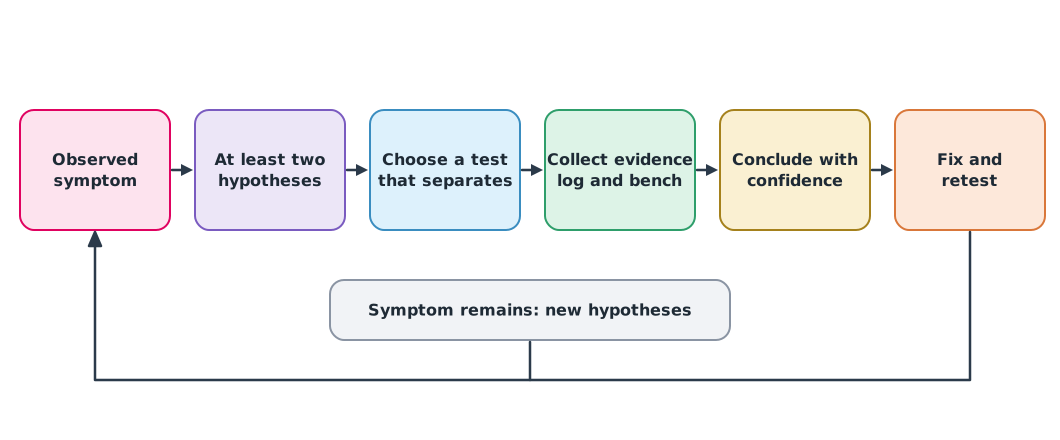
- Build a fault tree from a symptom and form at least two hypotheses that can be tested separately
- Estimate battery internal resistance from logged voltage and current
- Read imbalance in motor output commands to find a part working abnormally hard
- Handle missing log data correctly and write conclusions with a confidence level
Why this matters
“The drone leans right, so replace the right motor” is a guess that wastes money and time, and if it is wrong the symptom returns on the next flight. A good technician works like a doctor: listen to the symptoms, form several hypotheses, then choose tests that tell the hypotheses apart before deciding on a treatment. This module practises that way of thinking with real flight-controller logs.
The fault tree
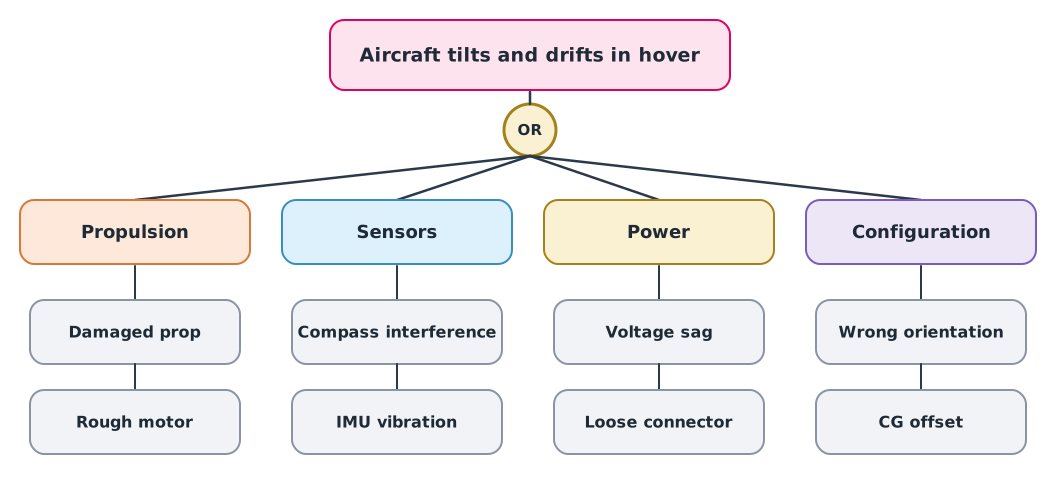
A fault tree puts the unwanted symptom at the top and branches down into possible causes. An OR gate means any one of the causes below can produce the event above. The tree helps you not to forget whole groups of causes you had not thought of.
The diagnosis loop
Three key principles:
- Separate observation from interpretation. Write “at 10:02:15 voltage fell from 23.6 to 22.7 V while current rose”, not “the battery is worn”
- Choose tests whose results differ between hypotheses. If a test gives the same result whichever hypothesis is true, it cannot decide between them
- A log is evidence of what the system recorded, not the whole truth. An abnormal value may come from a sensor, a cable or a communication link, not necessarily from the part the value describes
The ArduPilot documentation explains how to download and read logs with Mission Planner. Commonly used messages include BAT (battery), RCOU (outputs to the motors), VIBE (vibration) and ATT (attitude).
Evidence from voltage and current
A battery has internal resistance, like a narrow water pipe: the more current you draw, the more the terminal voltage sags. A worn battery or a loose connector raises the total resistance. It can be estimated from two steady segments of the same flight.
Example 1 Internal resistance from a log
v_hover, i_hover = 23.62, 19.8   # steady hover segment
v_climb, i_climb = 22.71, 46.5   # steady climb segment a few seconds later
r_pack = (v_hover - v_climb) / (i_climb - i_hover)
print(f"pack resistance about {r_pack * 1000:.1f} mΩ (register value when new: 17.0 mΩ)")
pack resistance about 34.1 mΩ (register value when new: 17.0 mΩ)The total resistance is twice the value when new. It includes the battery, connectors and wires, so it cannot yet tell a worn battery from a loose connector. A test that separates them: fly the same aircraft with a different battery. If the value returns to normal, the cause is the battery; if it stays high, check the aircraft’s connectors and wiring.
Evidence from motor commands
In a steady hover, all motors should receive similar commands. If one motor is consistently commanded higher than the others, the controller is making it work harder to hold attitude.
Example 2 Motor imbalance
rcou = {1: 1542, 2: 1538, 3: 1631, 4: 1529}   # mean PWM (µs) per motor during a steady hover
mean = sum(rcou.values()) / len(rcou)
for motor, pwm in rcou.items():
    print(f"motor {motor}: {pwm} µs ({pwm - mean:+.0f} from mean)")
motor 1: 1542 µs (-18 from mean)
motor 2: 1538 µs (-22 from mean)
motor 3: 1631 µs (+71 from mean)
motor 4: 1529 µs (-31 from mean)Motor 3 is clearly working harder. Possible hypotheses: that motor or propeller gives less thrust, the CG is offset towards it, or the motor is mounted at a tilt. Open the frame’s motor map to see where motor 3 is, then check the CG first, since it is easy and needs no disassembly. Next, swap propellers between motor 3 and another motor: if the imbalance moves with the propeller, the propeller is the cause.
Missing data
Logs may have gaps, for example when the telemetry link drops. A gap is not a zero. Filling missing values with 0 creates a “voltage drop to zero” that never happened.
import pandas as pd

log = pd.DataFrame({"time_s": [0, 1, 2, 3, 4],
                    "volt": [23.1, 23.0, None, None, 22.9],
                    "link": ["ok", "ok", "lost", "lost", "ok"]})
print("min voltage if gaps are read as 0:", log["volt"].fillna(0).min())
print("min voltage from real samples:   ", log["volt"].min())
gaps = log["volt"].isna()
print("missing samples:", int(gaps.sum()), "| all during link loss:", bool((log.loc[gaps, "link"] == "lost").all()))
min voltage if gaps are read as 0: 0.0
min voltage from real samples: 22.9
missing samples: 2 | all during link loss: TrueThe missing samples coincide exactly with the link loss, which supports a communication problem rather than a voltage drop, but it does not prove the physical cause of the link loss. If an onboard (DataFlash) log exists for the same period, open it, because it does not depend on the radio link.
Writing honest conclusions
A good diagnostic report states the symptom, every hypothesis, the evidence for and against each, what the log cannot tell, a conclusion with a confidence level, and the next check. If you cannot yet conclude, say so and state what data is still needed. Do not recommend replacing parts on a single piece of evidence.
Module lab
Lab: diagnosing a fault set by the instructor
- The instructor introduces one fault into a training drone without telling the group, such as an unbalanced propeller or a disturbed compass.
- Fly a supervised test, record the symptoms you observe, and build the group’s fault tree.
- Form at least two hypotheses and design tests that separate them, such as swapping propellers, changing batteries or checking vibration.
- Analyse the log with the code in this lesson (resistance, motor imbalance and data gaps).
- Write a diagnostic report with a confidence level, then compare it with the instructor’s answer.
Common mistakes
Watch out
- Replacing parts before forming hypotheses, so the real cause is never known
- Changing several things at once, so you cannot tell which fix worked
- Filling missing data with zeros, creating events that never happened
- Believing log values are always true, without considering that sensors or links can be wrong
- Writing conclusions more confident than the evidence
Summary
- A fault tree helps list all causes before starting repairs
- Diagnose with several hypotheses, and choose tests whose results differ between them
- Internal resistance is estimated as voltage drop divided by current rise, and includes connectors and wiring
- Imbalanced motor commands show which motor works hard, but not yet why
- Missing data must stay as gaps, and conclusions must state their confidence
Check your understanding
- Voltage falls from 24.0 to 23.4 V as current rises from 10 to 40 A. What is the approximate total resistance?
- Four motors receive 1500, 1500, 1500 and 1580 µs. How far is the last motor from the mean?
- What does an OR gate in a fault tree mean?
- Why should missing voltage data not be replaced with zeros?
- Total resistance is abnormally high. Which test separates a battery cause from an aircraft connector cause?
Answers
- , or 20 mΩ
- The mean is 1520 µs, so the last motor is 60 µs higher
- Any one of the causes below can produce the event above
- It creates a voltage-drop event that never happened and leads to wrong conclusions
- Use a different battery on the same aircraft, or the same battery on another aircraft, and see whether the abnormal value follows the battery
Key formulas
| Approximate internal resistance | |
| Motor deviation from the mean |
Key references
- ArduPilot Dev Team. Downloading and analyzing data logs in Mission Planner. ArduPilot Copter documentation. link
- ArduPilot Dev Team. Measuring vibration. ArduPilot Copter documentation. link
- ArduPilot Dev Team. Battery failsafe. ArduPilot Copter documentation. link
- Federal Aviation Administration. (2023). Aviation maintenance technician handbook – General (FAA-H-8083-30B). link
- ASTM International. (2019). Standard specification for continued airworthiness of lightweight unmanned aircraft systems (ASTM F2909-19). link
Further reading
Study the assigned knowledge units in advance, review media and take the module quiz
In class / field
Intensive lab and field practice recorded in a lab notebook
Learning evidence: Lab notebook signed by the instructor