Rapid mapping
UAT 364 Unmanned Aircraft Systems Technology for Public Safety and Emergency Management
Lesson
By the end of this module you will be able to
- Choose rapid mapping deliverables that match the decision-maker's question
- Compute flooded area and the number of affected buildings from a classified grid
- Report coverage, data age and completeness of a map separately
- Explain the use of satellite data, AI training datasets and the limits of images without coordinates
Why this matters
The command post must decide within the hour which villages are surrounded by water, which roads are still usable and where to send boats. Waiting for a complete 3D model takes too long. Rapid mapping answers urgent questions with sufficient data, but must state clearly how far it covers, when the images were taken and what is not yet confirmed. Otherwise gaps on the map may be read as safe areas.
Rapid mapping versus full mapping
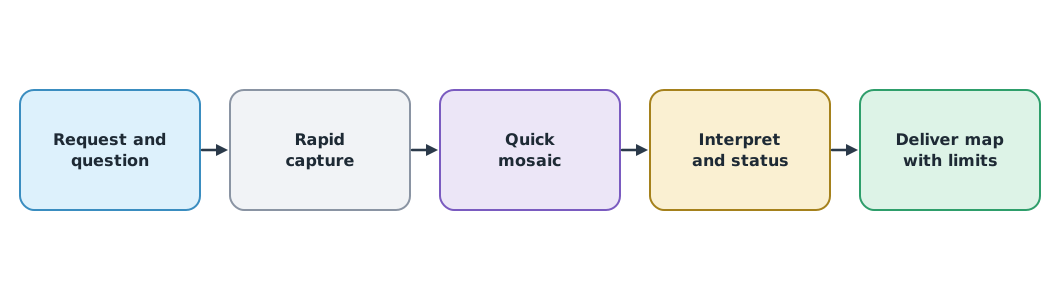
A rapid map may be a quick mosaic without GCPs, or single images with numbered points: enough to show “roughly what is where”, but not for precise measurement. Work that needs areas or volumes must follow the UAT 361 workflow. Images without complete coordinate data should not be placed on a map by guessing their position.
At national and international level there are satellite mapping mechanisms. The Copernicus Emergency Management Service (Rapid Mapping) provides free maps of disaster extent and damage within hours to days to authorised users, and the International Charter Space and Major Disasters provides free satellite data when a registered national disaster authority requests it. Satellites cover wide areas, while drones are more detailed and can fly under cloud, so they complement each other.
Analysing flooded area
Example 1. Flooded area and affected houses from a grid
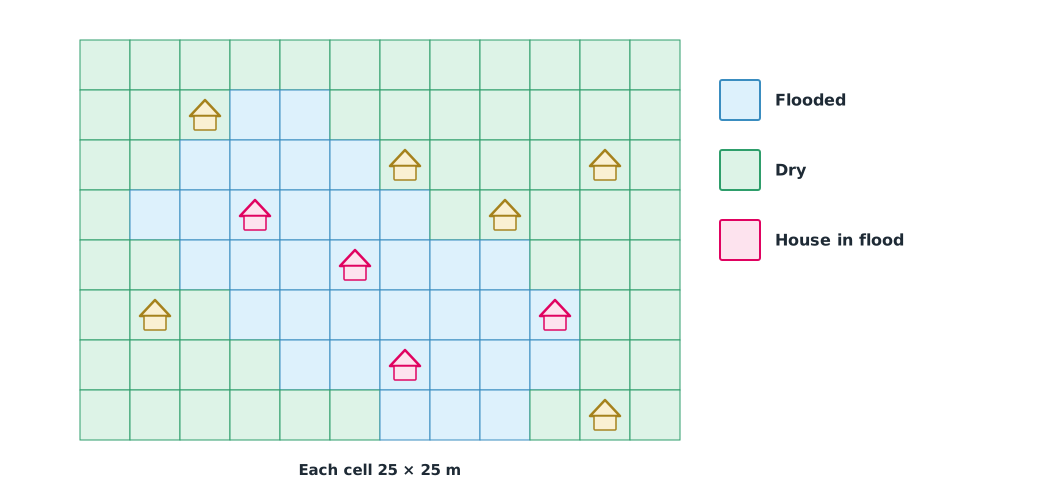
An 8 × 12 grid of 25 × 25 m cells classified by the analyst (~ = flooded), with assumed house locations.
CELL_M = 25
flood = ["............", "...~~.......", "..~~~~......", ".~~~~~~.....",
         "..~~~~~~~...", "...~~~~~~~..", "....~~~~~~..", "......~~~..."]
houses = [(1, 2), (2, 6), (3, 3), (3, 8), (4, 5), (5, 1), (5, 9), (6, 6), (7, 10), (2, 10)]

wet = sum(row.count("~") for row in flood)
area_ha = wet * CELL_M ** 2 / 10_000
hit = [h for h in houses if flood[h[0]][h[1]] == "~"]
print(f"flooded cells {wet} of {len(flood) * len(flood[0])} = {area_ha:.2f} ha")
print(f"houses in flooded cells: {len(hit)} of {len(houses)} -> {hit}")
flooded cells 35 of 96 = 2.19 ha
houses in flooded cells: 4 of 10 -> [(3, 3), (4, 5), (5, 9), (6, 6)]These numbers come from image classification, not confirmation that every house is actually flooded. They must carry “pending” status until a ground team or more detailed images confirm them.
Coverage, age and completeness are different questions
The knowledge unit on drills separates three indicators. Coverage is the share of the area with usable data. Data age is the time from capture to use. Completeness is the share of required items that have usable data. A map may cover almost the whole area yet be several hours old in a fast-rising flood.
Example 2. Reporting map indicators
from datetime import datetime

aoi_cells, no_data_cells = 96, 6
captured = datetime(2026, 9, 20, 7, 40)
used = datetime(2026, 9, 20, 11, 10)
required_items = ["bridge B1", "school shelter", "road R12", "clinic", "pump station"]
valid_items = ["bridge B1", "school shelter", "clinic"]

coverage = (aoi_cells - no_data_cells) / aoi_cells
age_h = (used - captured).total_seconds() / 3600
completeness = len(valid_items) / len(required_items)
missing = [i for i in required_items if i not in valid_items]
print(f"coverage {coverage:.1%}, data age {age_h:.1f} h, completeness {completeness:.0%}")
print("still missing:", missing)
coverage 93.8%, data age 3.5 h, completeness 60%
still missing: ['road R12', 'pump station']Coverage is nearly complete, but the data is over three hours old and the status of road R12 and the pump station is still missing. The report must give all three numbers with the list of missing items.
Training datasets and AI
Training AI to classify floods and damage uses labelled drone image datasets such as FloodNet (Rahnemoonfar and colleagues, 2021), post-flood imagery, and RescueNet (2023), 4,494 images after Hurricane Michael with 10 damage classes. Read the data licence conditions first, and AI results must be checked by people, as in the WFP example where AI counted damaged houses and specialists reviewed the results.
Module lab
Lab: a situation map within one hour
- Take a hypothetical request from the command post and write the question the map must answer and the data cut-off time
- Fly a rapid capture of the training area, make a quick mosaic and classify it into a grid
- Use Example 1 to compute affected area and buildings, and give every item a status
- Use Example 2 to report coverage, age and completeness
- Deliver the map with its limits, and have the recipient point out the unconfirmed items
Common mistakes
Watch out
- Leaving gaps that look like safe areas
- Placing images without coordinates by guessing their position
- Not stating capture time when the situation is changing fast
- Reporting AI results as confirmed
- Combining indicators into a single number, hiding missing items
Summary
- Rapid maps answer urgent questions with sufficient data, but must state extent, time and status
- Satellites (Copernicus EMS, International Charter) and drones complement each other
- Areas and buildings from classification still need confirmation
- Coverage, data age and completeness are different questions and must be reported separately
Check your understanding
- 40 flooded cells of 20 × 20 m each are how many hectares?
- An area of interest of 200 cells has 10 with no data. What is the coverage?
- Images captured at 06:30 are used at 09:00. How many hours old is the data?
- Why are gaps on a rapid map dangerous?
- What status should AI counts of damaged houses have before review?
Answers
- ha
- 2.5 hours
- They may be read as safe areas when they simply have no data
- Pending
Key formulas
| Data coverage | |
| Data age | |
| Item completeness |
Key references
- World Food Programme. (2020, January 31). Joining the dots: How AI and drones are transforming emergencies. link
- European Commission. Copernicus Emergency Management Service – Rapid Mapping. link
- International Charter Space and Major Disasters. About the Charter. link
- Rahnemoonfar, M., Chowdhury, T., Sarkar, A., Varshney, D., Yari, M., & Murphy, R. R. (2021). FloodNet: A high resolution aerial imagery dataset for post flood scene understanding. IEEE Access, 9, 89644–89654. link
- Rahnemoonfar, M., Chowdhury, T., & Murphy, R. (2023). RescueNet: A high resolution UAV semantic segmentation dataset for natural disaster damage assessment. Scientific Data, 10, 913. link
- Murphy, R. R. (2014). Disaster robotics. MIT Press. link
Further reading
Study the assigned knowledge units in advance, review media and take the module quiz
In class / field
Intensive lab and field practice recorded in a lab notebook
Learning evidence: Lab notebook signed by the instructor