Risk management and SMS
UAT 401 UAS Regulations, Safety and Risk Management
Lesson
By the end of this module you will be able to
- Analyse hazardous events with bow-tie diagrams and compute the effect of barriers
- Explain how common-cause failure affects the reliability of barriers
- Set alert levels for safety performance indicators following ICAO Doc 9859
- Interpret event rates with Poisson confidence intervals
Why this matters
UAT 313 set out the four components of an SMS, risk matrices and before-and-after indicators. The drone knowledge base’s unit on safety management systems stresses policy, hazard identification, risk assessment and a reporting culture, and its unit on evidence-based risk assessment warns that mitigations must explain their mechanism and evidence: naming a mitigation in a table does not prove it works. This module gives Fah Sai Survey’s safety manager two tools to answer that with numbers: bow-ties and indicators with confidence intervals.
Bow-ties and barriers
A bow-tie diagram places the top event in the centre, with threats and preventive barriers on the left and consequences and mitigating barriers on the right. The UK Civil Aviation Authority uses bow-tie models in risk management (CAP 1329). If each barrier fails independently, the outcome rate is the product of the barriers’ failure probabilities, the same principle as fault tree analysis (IEC 61025). But if two barriers depend on the same thing, multiplying as if independent greatly overstates safety.
Example 1 A geofence and a flight termination system sharing one GNSS
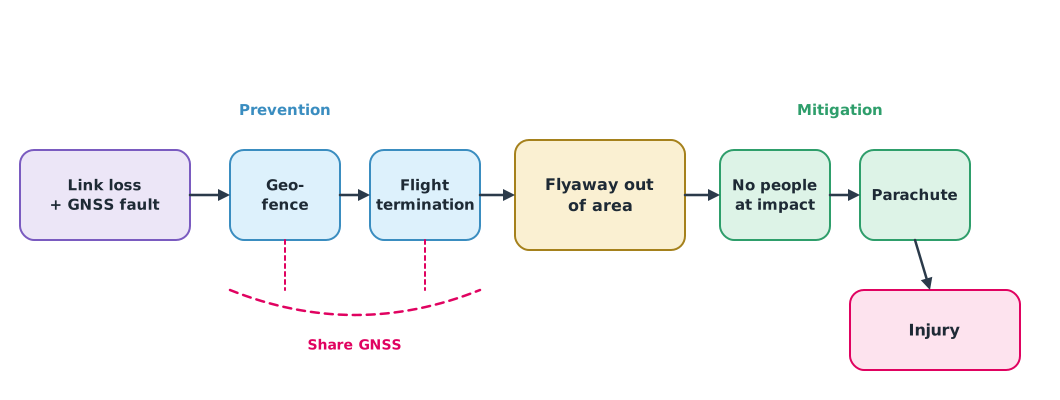
The top event is a flyaway when the link is lost together with a GNSS fault. The two preventive barriers are a geofence and a flight termination system; the mitigations are the chance that no one is at the impact point and a parachute. All values are assumed for teaching.
rate_top = 2e-3        # link loss with GNSS fault per flight hour (assumed)
p_geofence = 0.10      # probability the geofence fails
p_fts = 0.05           # probability flight termination fails
p_people = 0.30        # probability people are at the impact point
p_chute = 0.20         # probability the parachute does not reduce severity

def injury_rate(shared_gnss):
    if shared_gnss:
        # geofence and termination share one GNSS: when GNSS fails, both fail together
        p_escape = 1.0
    else:
        p_escape = p_geofence * p_fts
    return rate_top * p_escape * p_people * p_chute

for name, shared in [("independent barriers", False), ("shared GNSS", True)]:
    r = injury_rate(shared)
    print(f"{name:21s} injury rate {r:.1e} per flight hour"
          f" = one per {1/r:,.0f} h")
independent barriers injury rate 6.0e-07 per flight hour = one per 1,666,667 h
shared GNSS injury rate 1.2e-04 per flight hour = one per 8,333 hIf the two barriers were independent, the injury rate would be about one per 1.7 million flight hours. But because both take position from the same GNSS, when GNSS fails both fail together, and the rate becomes two hundred times worse. The fix is to separate the barriers’ data sources, for example triggering flight termination from link loss or an independent position source, and to prove it by testing.
Indicators and alert levels
ICAO Doc 9859, 4th edition (2018), describes setting alert levels (triggers) for safety performance indicators from the mean of the preceding period plus one or two population standard deviations, and cautions that triggers are less meaningful for systems in which people play a major part. An alert level is a signal to review, not proof that safety has worsened. When event counts are small, measured rates swing widely by chance. The exact Poisson confidence interval (Garwood, 1936) shows how uncertain the observed value is.
Example 2 Is the link really failing more often this quarter?
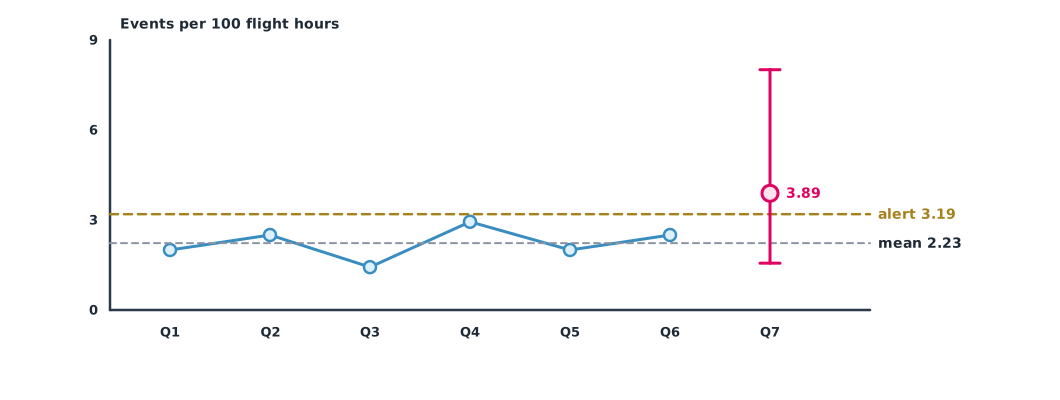
The company recorded link-loss events over the past six quarters. This quarter had 7 events in 180 flight hours (hypothetical data).
import numpy as np
from scipy.stats import chi2

events = np.array([3, 4, 2, 5, 3, 4])            # link-loss events per quarter, previous 6 quarters
hours = np.array([150, 160, 140, 170, 150, 160])  # flight hours per quarter
rate = events / hours * 100                       # per 100 flight hours
mean, sd = rate.mean(), rate.std()                    # population SD as in ICAO Doc 9859
print(f"past rates per 100 h: {np.round(rate, 2)}")
print(f"mean {mean:.2f}  SD {sd:.2f}  alert (mean + 2SD) {mean + 2*sd:.2f}")

k, h = 7, 180                                     # current quarter
lo = chi2.ppf(0.025, 2*k) / 2 / h * 100
hi = chi2.ppf(0.975, 2*(k + 1)) / 2 / h * 100
print(f"current {k/h*100:.2f} per 100 h, exact 95% CI {lo:.2f} to {hi:.2f}")
past rates per 100 h: [2. 2.5 1.43 2.94 2. 2.5 ]
mean 2.23 SD 0.48 alert (mean + 2SD) 3.19
current 3.89 per 100 h, exact 95% CI 1.56 to 8.01This quarter’s rate of 3.89 per 100 hours exceeds the 3.19 alert level, so a review is required. But the 95% confidence interval runs from 1.56 to 8.01, which includes the previous mean of 2.23, so one quarter’s data cannot yet show a real change. A good review looks at the details of all seven events for a common cause, such as a new area, new firmware or a changed antenna, rather than judging from the number alone.
Class activity
Activity: the company’s bow-tie and indicators
- Choose one top event, such as a battery running out mid-flight, and draw a bow-tie with at least three threats and two consequences
- State what each barrier depends on and find pairs that could fail together
- Enter assumed values and compute with Example 1, comparing the independent and common-cause cases
- Choose two indicators, set alert levels from hypothetical historical data, and compute confidence intervals
- Write the procedure when an indicator exceeds its alert level: who reviews what within how many days
Common mistakes
Watch out
- Multiplying barrier probabilities as if independent when they share sensors or power
- Naming barriers in a bow-tie without evidence that they work
- Treating an alert as proof that things have worsened
- Concluding from one quarter when event counts are small
- Not stating the denominator, such as events per flight hour or per flight
Summary
- A bow-tie shows threats, preventive barriers, the top event, mitigating barriers and consequences
- Barriers that depend on the same thing can fail together, making independent products misleading
- ICAO Doc 9859 sets alert levels from the mean plus standard deviations, as a signal to review
- Poisson confidence intervals show the uncertainty of rates when events are few
Check your understanding
- A top event at 1×10⁻³ per hour passes through two independent barriers with failure probabilities 0.1 and 0.1. What rate gets through?
- If those two barriers use the same sensor and the top event is caused by that sensor failing, what rate gets through?
- With a mean of 2.0 and a standard deviation of 0.5, what is the two-SD alert level?
- What should happen when an indicator exceeds its alert level?
- Why is the confidence interval wide when events are few?
Answers
- per hour
- per hour, because both barriers fail with the top event
- Review the details of the events for a common cause, rather than concluding at once that things are worse
- Counts swing a lot by chance relative to a low mean
Key formulas
| Outcome rate through independent barriers | |
| Alert level | |
| Exact Poisson confidence interval |
Key references
- International Civil Aviation Organization. (2018). Safety management manual (Doc 9859, 4th ed.). link
- International Civil Aviation Organization. (2016). Annex 19 to the Convention on International Civil Aviation: Safety management (2nd ed.). link
- UK Civil Aviation Authority. (n.d.). CAA strategy for bowtie risk models (CAP 1329). link
- International Electrotechnical Commission. (2006). Fault tree analysis (FTA) (IEC 61025:2006, Ed. 2.0). link
- Garwood, F. (1936). Fiducial limits for the Poisson distribution. Biometrika, 28(3–4), 437–442. link
- International Organization for Standardization. (2018). Risk management – Guidelines (ISO 31000:2018). link
Further reading
Study the assigned knowledge units in advance, review media and take the module quiz
In class / field
Lecture, case discussion and in-class problem solving
Learning evidence: Quiz results and submitted exercises