Report and presentation
UAT 497 Work-Integrated Learning in Unmanned Aircraft Systems and Automation Technology
Lesson
By the end of this module you will be able to
- Write a placement report following the structure of a professional report
- Measure improvement project results before and after, numerically
- Protect the organisation's confidential information and personal data in the report and presentation
- Explain the three-party rubric assessment and compute the final score
Why this matters
The report and presentation are what outsiders see of the whole placement. Good work told unclearly looks ordinary; on the other hand, overstating results beyond the data or revealing client information can damage the trust between the university and the company.
Report structure
Markel and Selber’s Technical Communication (2025) advises writing for readers with little time, putting conclusions before details. A workable structure for a placement report:
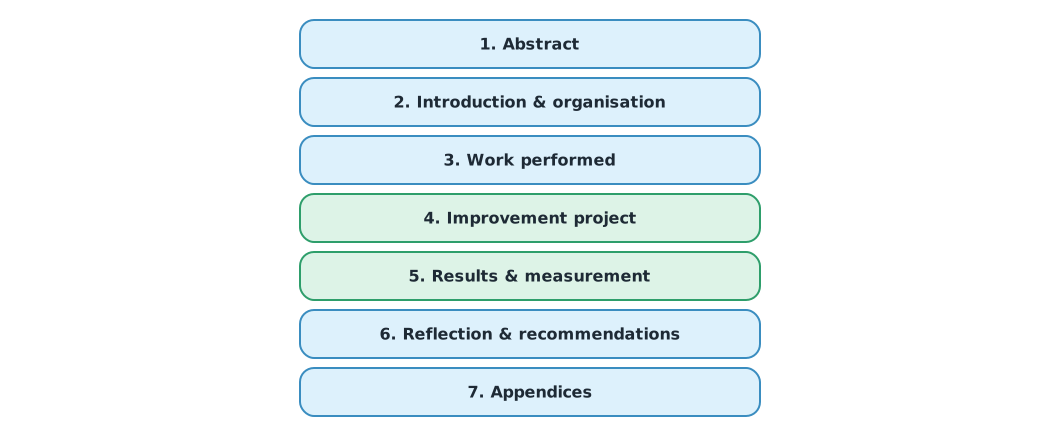
- Abstract: summarise the work, the project and the numerical results in one paragraph.
- Work performed: drawn from the logbook and linked to the CLOs.
- Improvement project: following the PDCA cycle from Module 4.
- Results and measurement: before-and-after numbers with the limits of the data.
- Reflection: the most important Gibbs entries.
Measuring before and after
Example 1 Mission setup time before and after the battery status system
Time from arriving on site to ready for take-off (minutes), for ten missions before and ten after (hypothetical data).
import statistics as st

before = [34, 41, 29, 52, 38, 45, 31, 60, 36, 40]
after = [27, 30, 25, 33, 28, 29, 26, 35, 31, 27]
for name, xs in (("before", before), ("after", after)):
    print(f"{name:<6}: mean {st.mean(xs):5.1f} min, median {st.median(xs):4.1f}, max {max(xs)}, sd {st.stdev(xs):4.1f}")
change = (st.mean(after) - st.mean(before)) / st.mean(before) * 100
print(f"mean change {change:+.1f}%, spread (sd) {st.stdev(before):.1f} -> {st.stdev(after):.1f} min")
print(f"missions over 40 min: {sum(x > 40 for x in before)} -> {sum(x > 40 for x in after)}")
before: mean 40.6 min, median 39.0, max 60, sd 9.6
after : mean 29.1 min, median 28.5, max 35, sd 3.2
mean change -28.3%, spread (sd) 9.6 -> 3.2 min
missions over 40 min: 4 -> 0The mean fell by about 28%, and more importantly the variation fell sharply: missions over 40 minutes disappeared. The report must also state limitations, such as ten missions being few, better weather in the later period, and the team trying harder because it knew it was being measured.
Confidentiality and personal data
Before submitting the report or presenting, have the mentor check that nothing conflicts with the non-disclosure agreement, such as client names, prices or sensitive site coordinates, and remove or blur faces and number plates in images under Thailand’s PDPA B.E. 2562 (2019). Where needed, use proportions or anonymised data.
Three-party assessment
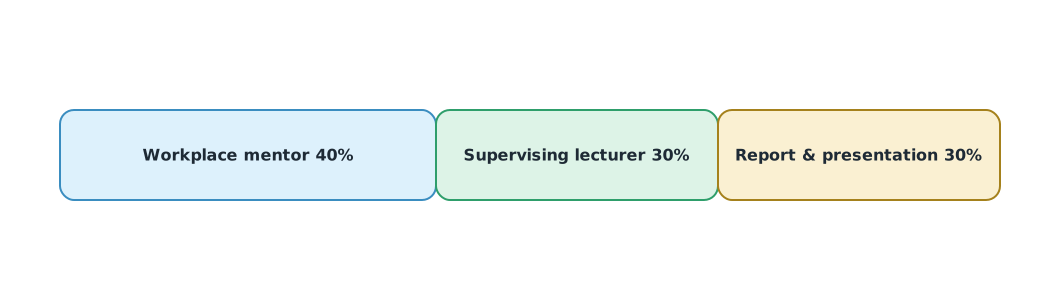
This course is assessed by the workplace mentor (40%), the supervising lecturer (30%) and the report and presentation (30%). Ferns and Zegwaard (2014) note that WIL assessment is challenging because several assessors hold different standards, so a rubric describing each level of each criterion clearly should be used and shown to students from the start.
Example 2 Final score from rubrics
Each party scores levels 1–4 against the rubric criteria (hypothetical values).
rubrics = {   # assessor: (weight, {criterion: level 1–4})
    "workplace mentor": (0.40, {"technical work": 4, "safety & quality": 3, "teamwork": 4, "punctuality": 3}),
    "supervising lecturer": (0.30, {"learning plan": 3, "reflection": 3, "site visit discussion": 4}),
    "report & presentation": (0.30, {"structure": 3, "evidence & data": 4, "confidentiality": 4, "delivery": 3}),
}
MAX_LEVEL = 4
total = 0.0
for who, (w, scores) in rubrics.items():
    pct = sum(scores.values()) / (MAX_LEVEL * len(scores)) * 100
    total += w * pct
    low = [k for k, v in scores.items() if v < MAX_LEVEL]
    print(f"{who:<22} {pct:5.1f}% x {w:.2f}  to improve: {', '.join(low)}")
print(f"final score {total:.1f}%")
workplace mentor 87.5% x 0.40 to improve: safety & quality, punctuality
supervising lecturer 83.3% x 0.30 to improve: learning plan, reflection
report & presentation 87.5% x 0.30 to improve: structure, delivery
final score 86.2%The final score gives the overall level, but the more useful part is the criteria not yet at full marks, which show what to develop before real work. These results also map onto the four learning-outcome domains, for example safety to ethics and punctuality to character.
End-of-term activity
Activity: report and presentation
- Draft the report following Figure 1, including results from Example 1 with the project’s real data.
- Have the mentor check confidentiality and personal data before submitting.
- Prepare a 15-minute presentation focused on the problem, data, fix and measured results.
- Assess yourself with the same rubric as the assessors and compare with the real results.
- Write a thank-you letter to the company and summarise recommendations for next year’s students.
Common mistakes
Watch out
- Telling the work week by week instead of summarising results and findings.
- Claiming more than the data shows, without limitations.
- Including client names, prices or images of people without permission.
- Not reading the rubric before writing.
- Forgetting to thank the company and hand over the work.
Summary
- A professional report puts conclusions first and centres on the improvement project and measured results.
- Measure before and after with mean, median and spread, and state limitations.
- Protect confidentiality under the NDA and personal data under the PDPA.
- The 40/30/30 joint assessment uses clear rubrics shared from the start.
Check your understanding
- Mentor 90%, lecturer 80%, report 70%: what is the final score?
- Mean time falls from 40 to 30 minutes. What percentage is that?
- Why report the spread as well as the mean?
- A 1–4 rubric with four criteria scoring 3, 4, 3, 2 is what percentage?
- Who should check confidentiality before the report is submitted?
Answers
- Lower spread makes planning more predictable, and a mean alone can hide extreme values.
- The workplace mentor, together with the student and the supervising lecturer.
Key formulas
| Weighted final score | |
| Relative change |
Key references
- Markel, M., & Selber, S. A. (2025). Technical communication (14th ed.). Macmillan Learning. link
- Ferns, S., & Zegwaard, K. E. (2014). Critical assessment issues in work-integrated learning. Asia-Pacific Journal of Cooperative Education, 15(3), 179–188. link
- Zegwaard, K. E., & Pretti, T. J. (Eds.). (2023). The Routledge international handbook of work-integrated learning (3rd ed.). Routledge. link
- พระราชบัญญัติคุ้มครองข้อมูลส่วนบุคคล พ.ศ. 2562. ราชกิจจานุเบกษา, 136(69 ก), 52–95. link
- กฎกระทรวง มาตรฐานคุณวุฒิระดับอุดมศึกษา พ.ศ. 2565. (2565). ราชกิจจานุเบกษา. link
Further reading
Study the assigned knowledge units in advance, review media and take the module quiz
In class / field
Workplace practice under a supervisor
Learning evidence: Work log endorsed by the supervisor