Work phase 2
UAT 497 Work-Integrated Learning in Unmanned Aircraft Systems and Automation Technology
Lesson
By the end of this module you will be able to
- Choose an improvement project topic from data using a Pareto chart
- Find root causes with a fishbone diagram and 5 Whys
- Plan the project with the PDCA cycle and find the critical path with CPM
- Manage the scope, time and risks of a small project in the organisation
Why this matters
In the second phase, students know the work and start to see recurring problems. An improvement project is a chance to use their knowledge for the organisation’s benefit, and it forms the core of the final report. A good project is small enough to finish in six or seven weeks yet clearly measurable.
PDCA
ISO 9001:2015 uses the PDCA cycle together with risk-based thinking as the core of process management (ISO published ISO 9001:2026 in September 2026). The cycle suits improvement projects:
- Plan: choose a problem from data, find causes and plan the fix.
- Do: try the fix on a small scale.
- Check: measure results against the situation before the fix.
- Act: if it works, make it standard; if not, start a new cycle.
Choosing the problem with Pareto
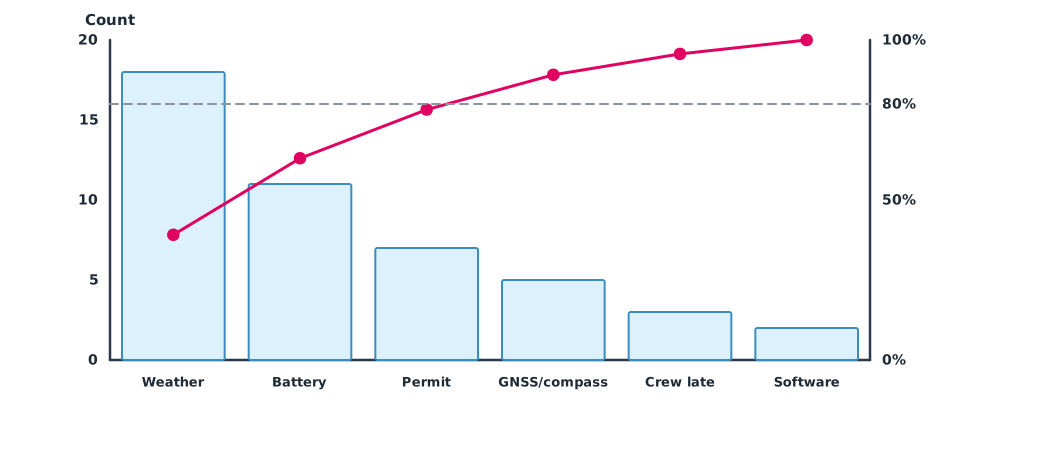
ASQ describes the Pareto chart as causes sorted from largest to smallest with a cumulative line, to find the “vital few” that cause most of the problem.
Example 1 Why missions start late
Causes of missions starting later than scheduled over two months (hypothetical data).
delays = {"weather": 18, "battery not charged": 11, "missing permit": 7,
          "GNSS/compass issue": 5, "crew late": 3, "software update": 2}
total = sum(delays.values())
cum = 0
for cause, n in sorted(delays.items(), key=lambda kv: -kv[1]):
    cum += n
    print(f"{cause:<20} {n:>2}  {n / total:5.1%}  cumulative {cum / total:5.1%}")
controllable = {k: v for k, v in delays.items() if k != "weather"}
top = max(controllable, key=controllable.get)
print(f"largest cause the team controls: {top} ({controllable[top] / total:.0%} of all delays)")
weather 18 39.1% cumulative 39.1%
battery not charged 11 23.9% cumulative 63.0%
missing permit 7 15.2% cumulative 78.3%
GNSS/compass issue 5 10.9% cumulative 89.1%
crew late 3 6.5% cumulative 95.7%
software update 2 4.3% cumulative 100.0%
largest cause the team controls: battery not charged (24% of all delays)Weather is the largest cause but cannot be controlled. The largest cause the team does control is batteries not ready, which makes a good project topic.
Finding root causes
- A fishbone (Ishikawa) diagram sorts causes into categories such as people, methods, equipment, materials, environment and measurement, helping the team think broadly (Ishikawa, 1976).
- 5 Whys keeps asking “why?” until a fixable cause is reached. Ohno (1988) used it in the Toyota Production System. For example: batteries not ready, because they were not charged, because nobody knew which were empty, because there were no status labels, because there was no post-flight procedure, a cause fixed with a procedure and status labels.
Planning with CPM
The critical path method of Kelley and Walker (1959) finds the longest chain of tasks, which sets the project’s finish time. Any delay on the critical path delays the whole project, while other tasks have slack to move. The PMBOK Guide, 8th edition (2025), uses this idea in schedule management.
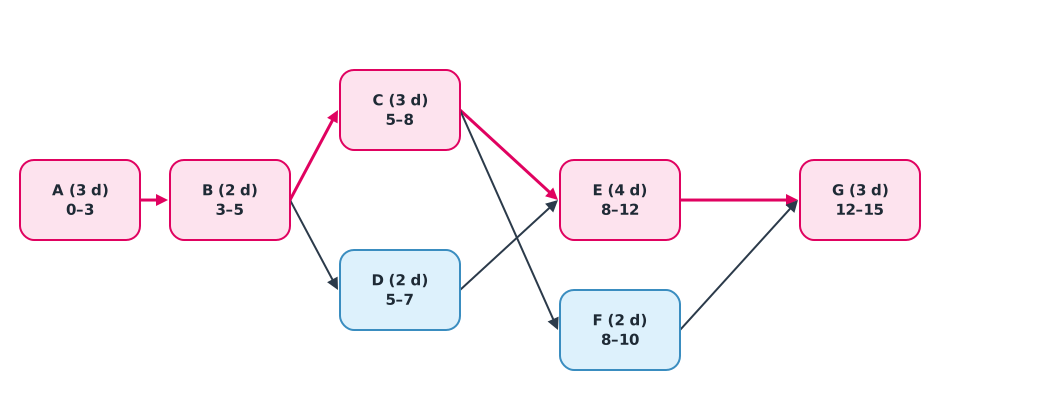
Example 2 Plan for a battery status system project
Tasks (working days) and the tasks that must finish first.
tasks = {   # task: (days, predecessors)
    "A study current process": (3, []),
    "B root-cause analysis": (2, ["A study current process"]),
    "C design status labels & checklist": (3, ["B root-cause analysis"]),
    "D charging schedule": (2, ["B root-cause analysis"]),
    "E pilot test": (4, ["C design status labels & checklist", "D charging schedule"]),
    "F train crew": (2, ["C design status labels & checklist"]),
    "G measure & report": (3, ["E pilot test", "F train crew"]),
}
es, ef = {}, {}
for t, (d, pre) in tasks.items():
    es[t] = max((ef[p] for p in pre), default=0)
    ef[t] = es[t] + d
end = max(ef.values())
lf, ls = {}, {}
for t in reversed(list(tasks)):
    succ = [s for s, (_, pre) in tasks.items() if t in pre]
    lf[t] = min((ls[s] for s in succ), default=end)
    ls[t] = lf[t] - tasks[t][0]
for t in tasks:
    slack = ls[t] - es[t]
    print(f"{t:<36} ES {es[t]:>2} EF {ef[t]:>2} slack {slack} {'CRITICAL' if slack == 0 else ''}")
print(f"project duration {end} working days")
A study current process ES 0 EF 3 slack 0 CRITICAL
B root-cause analysis ES 3 EF 5 slack 0 CRITICAL
C design status labels & checklist ES 5 EF 8 slack 0 CRITICAL
D charging schedule ES 5 EF 7 slack 1
E pilot test ES 8 EF 12 slack 0 CRITICAL
F train crew ES 8 EF 10 slack 2
G measure & report ES 12 EF 15 slack 0 CRITICAL
project duration 15 working daysThe critical path is A–B–C–E–G, 15 working days in total. The charging schedule (D) has one day of slack and crew training (F) has two. If the mentor is unavailable during the pilot test (E), the project slips immediately, so book that time early.
Improvement project activity
Activity: one PDCA cycle
- Collect data on a recurring problem for at least four weeks and draw a Pareto chart with Example 1.
- Build a fishbone diagram and do 5 Whys with the team.
- Write a one-page project scope (problem, metric, target, what is out of scope) for the mentor to approve.
- Plan the work with CPM as in Example 2 and list the project’s risks.
- Try the fix on a small scale and collect data to measure results in Module 5.
Common mistakes
Watch out
- Choosing a topic by feel instead of data.
- Choosing an uncontrollable cause as the project.
- Stopping at symptoms without asking down to the root cause.
- A scope too large to finish during the placement.
- Collecting no data before the fix, so results cannot be measured.
Summary
- PDCA gives the structure of an improvement project.
- Pareto points to the main causes, but choose one the team can control.
- Fishbone diagrams and 5 Whys help find root causes.
- CPM finds the critical path and slack to manage project time.
Check your understanding
- What does PDCA stand for?
- Causes occur 20, 10, 5 and 5 times. What share is the first?
- Task A takes 2 days, B 3 days after A, C 1 day after A, and D 2 days after both B and C. How long is the project?
- From question 3, how much slack does C have?
- Why should weather not be the improvement project topic even though it is the largest cause?
Answers
- Plan, Do, Check, Act.
- days (A–B–D).
- days.
- The team cannot control the weather; choose a fixable cause, or improve how planning copes with weather instead.
Key formulas
| Pareto cumulative share | |
| CPM |
Key references
- International Organization for Standardization. (2015). Quality management systems — Requirements (ISO 9001:2015). link
- ASQ. What is a Pareto chart? ASQ quality resources. link
- Ishikawa, K. (1976). Guide to quality control. Asian Productivity Organization. link
- Ohno, T. (1988). Toyota production system: Beyond large-scale production. Productivity Press. link
- Kelley, J. E., & Walker, M. R. (1959). Critical-path planning and scheduling. Papers presented at the Eastern Joint IRE-AIEE-ACM Computer Conference (pp. 160–173). link
- Project Management Institute. (2025). A guide to the project management body of knowledge (PMBOK guide) (8th ed.). link
Further reading
Study the assigned knowledge units in advance, review media and take the module quiz
Professional practice in the workplace
Technology project management
In class / field
Workplace practice under a supervisor
Learning evidence: Work log endorsed by the supervisor