Testing and V&V
UAT 494 Unmanned Aircraft Systems and Automation Technology Capstone Project II
Lesson
By the end of this module you will be able to
- Distinguish verification from validation and choose among test, analysis, inspection and demonstration
- Evaluate detection results with a confusion matrix and Wilson confidence intervals
- Test numeric requirements with the mean and a one-sided t upper bound
- Make honest pass or fail decisions when results are uncertain
Why this matters
The committee will ask: “Does the system really meet its requirements, and how do you know?” A good answer comes from tests planned in the requirements verification matrix (RVM) from UAT 493, and it states the uncertainty of the result, not just a single number.
Verification and validation
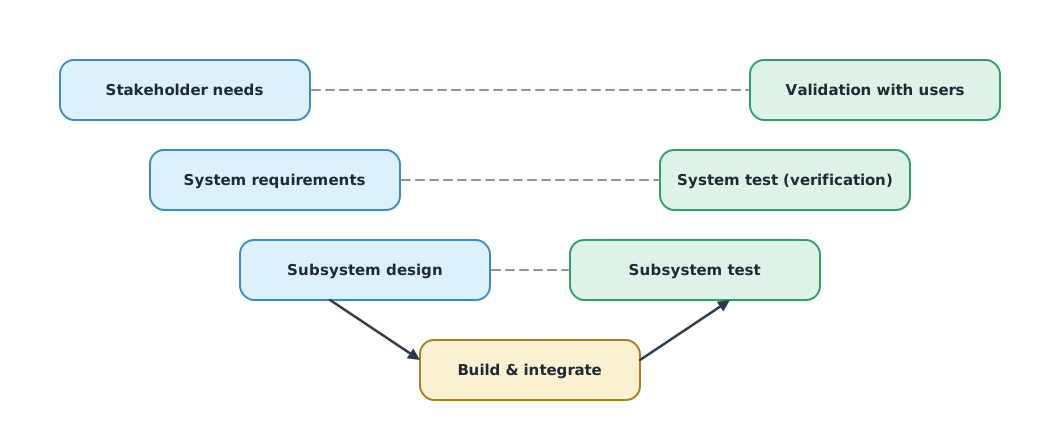
The NASA Systems Engineering Handbook explains that verification proves the product meets its requirements (“was it built right?”), while validation proves it does what users need in its real environment (“was the right thing built?”). There are four verification methods: test, measuring data from operation; analysis, using models; inspection, by examination; and demonstration, showing that it works. IEEE 1012-2024 defines the V&V processes for systems, software and hardware.
Detection results and confidence intervals
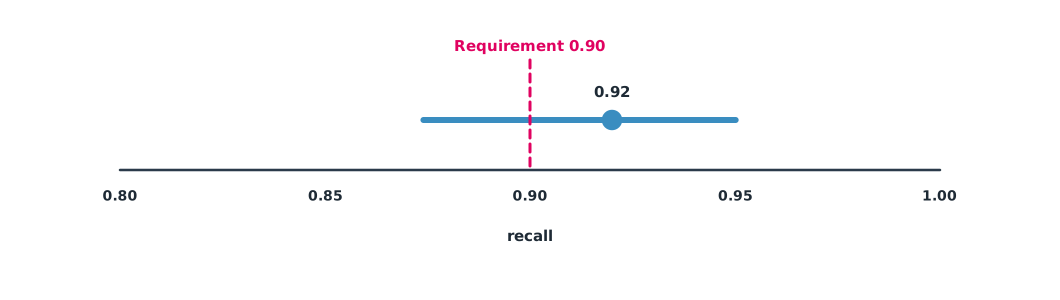
Requirement R1 from UAT 493 is to detect cracks 5 cm wide or more with a recall of at least 0.90. Counting a recall of 0.92 on one test set is not enough, because another test set might score lower. The NIST statistics handbook and Agresti and Coull (1998) recommend the Wilson (1927) interval for proportions.
Example 1 Recall and precision of the detector
The test images contain 200 labelled cracks. The system found 184 and raised 21 false alarms (hypothetical data).
import math

TP, FN, FP = 184, 16, 21
REQ = 0.90

def wilson(k, n, z=1.96):
    p = k / n
    d = 1 + z * z / n
    c = (p + z * z / (2 * n)) / d
    h = z * math.sqrt(p * (1 - p) / n + z * z / (4 * n * n)) / d
    return c - h, c + h

recall = TP / (TP + FN)
precision = TP / (TP + FP)
lo, hi = wilson(TP, TP + FN)
print(f"recall {recall:.3f}, 95% Wilson CI [{lo:.3f}, {hi:.3f}]; precision {precision:.3f}")
if lo >= REQ:
    print("R1 verified with 95% confidence")
elif recall >= REQ:
    print("R1 met on this sample but not with 95% confidence: report as 'met, not yet demonstrated'")
else:
    print("R1 not met")
need = next(n for n in range(100, 5000, 10) if wilson(round(0.92 * n), n)[0] >= REQ)
print(f"if true recall stays near 0.92, about {need} labelled cracks are needed to show R1 with 95% confidence")
recall 0.920, 95% Wilson CI [0.874, 0.950]; precision 0.898
R1 met on this sample but not with 95% confidence: report as 'met, not yet demonstrated'
if true recall stays near 0.92, about 830 labelled cracks are needed to show R1 with 95% confidenceThe point estimate meets the requirement, but the lower bound of the interval is below 0.90, so it cannot yet be confirmed with confidence. An honest report says “met on this test set, but not yet demonstrated with 95% confidence” and states how much more data is needed.
The flight time requirement
Example 2 R4: one 2 km round in at most 15 minutes
Ten real rounds were flown. Use a one-sided 95% upper bound of the mean, with from the NIST table.
import statistics as st

times = [13.2, 13.8, 12.9, 14.1, 13.5, 13.0, 14.4, 13.6, 13.3, 13.9]   # minutes
LIMIT, T95_DF9 = 15.0, 1.833
n, mean, s = len(times), st.mean(times), st.stdev(times)
upper = mean + T95_DF9 * s / n ** 0.5
print(f"mean {mean:.2f} min, sd {s:.2f}, 95% upper bound of the mean {upper:.2f} min")
print("R4 verified (mean)" if upper <= LIMIT else "R4 not verified")
print(f"longest single round {max(times)} min; rounds over limit: {sum(t > LIMIT for t in times)}")
mean 13.57 min, sd 0.49, 95% upper bound of the mean 13.85 min
R4 verified (mean)
longest single round 14.4 min; rounds over limit: 0The upper bound of the mean is clearly below the limit and no round exceeded it, so R4 is verified. The test conditions, such as wind speed and payload, must also be reported, because flight time depends on them.
Module lab
Lab: execute the RVM
- Review the RVM from UAT 493; every requirement needs a verification method and a pass criterion
- Prepare a test image set not used for training, labelled by someone who did not develop the model
- Compute recall and precision with Wilson intervals using Example 1
- Fly at least 10 timed rounds, record wind and payload, and analyse them with Example 2
- Validate with real irrigation staff at least once and record their feedback
Common mistakes
Watch out
- Testing with images used for training
- Reporting a single value with no confidence interval
- Reading “met on the sample” as “proven”
- Not recording test conditions
- Skipping validation with real users
Summary
- Verification checks the requirements; validation checks user needs in the real environment
- Proportions such as recall must be reported with a Wilson interval, comparing the lower bound with the requirement
- Numeric requirements use a t bound together with the extreme values
- Decide honestly and state what data is needed when something is not yet proven
Check your understanding
- Is “did we build the right thing?” verification or validation?
- TP 90, FN 10, FP 15. What are recall and precision?
- Recall is 0.92 but the 95% lower bound is 0.87 and the requirement is 0.90. How should it be reported?
- What are the four verification methods?
- Mean 14.0 min, s = 0.8, n = 10. What is the 95% upper bound (t = 1.833)?
Answers
- Validation
- recall , precision
- Met on this test set, but not yet demonstrated with 95% confidence; more testing is needed
- Test, analysis, inspection and demonstration
- min
Key formulas
| Wilson confidence interval | |
| One-sided upper bound of the mean |
Key references
- National Aeronautics and Space Administration. (2016). NASA systems engineering handbook (NASA/SP-2016-6105 Rev 2). link
- IEEE. (2025). IEEE standard for system, software, and hardware verification and validation (IEEE Std 1012-2024). link
- Wilson, E. B. (1927). Probable inference, the law of succession, and statistical inference. Journal of the American Statistical Association, 22(158), 209–212. link
- Agresti, A., & Coull, B. A. (1998). Approximate is better than "exact" for interval estimation of binomial proportions. The American Statistician, 52(2), 119–126. link
- NIST/SEMATECH. Confidence intervals for proportions (section 7.2.4.1). e-Handbook of statistical methods. link
- NIST/SEMATECH. Critical values of the Student's t distribution (section 1.3.6.7.2). e-Handbook of statistical methods. link
Further reading
Study the assigned knowledge units in advance, review media and take the module quiz
In class / field
Team project work, advisor meetings and progress presentations
Learning evidence: Project milestone deliverables