Safety and effectiveness evaluation
UAT 494 Unmanned Aircraft Systems and Automation Technology Capstone Project II
Lesson
By the end of this module you will be able to
- Estimate reliability from test flight hours with MTBF and the exponential model
- Calculate how many failure-free tests are needed to demonstrate reliability
- Measure usability with the SUS questionnaire
- Evaluate effectiveness against the existing method and review risks after testing
Why this matters
A system that met its requirements in a few tests may still not be ready for others to use. The committee and the users will go on to ask how often it fails, whether it is easy to use, and whether it is really better than the current method. This module gives numerical tools for those questions.
Reliability
When the failure rate is constant, the NIST handbook gives and estimates MTBF as total operating time divided by the number of failures. To demonstrate reliability with tests that have no failures at all, use (Luko, 1997). If tests all succeed, the 95% upper bound on the failure rate is about , the “rule of three” (Hanley and Lippman-Hand, 1983).
Example 1 From test flight hours to reliability
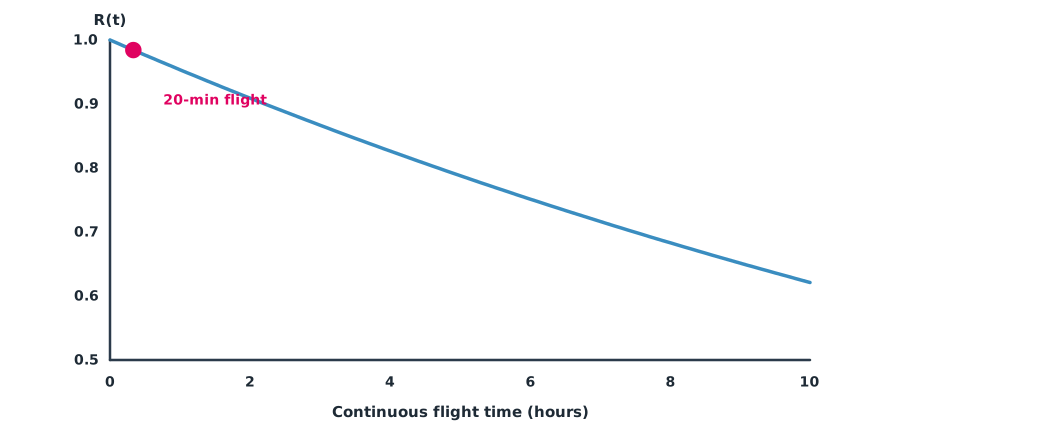
The team flew 42 test hours with 2 failures that aborted the mission. One canal inspection round takes about 20 minutes (hypothetical data).
import math

T_HOURS, FAILURES, MISSION_MIN = 42.0, 2, 20
mtbf = T_HOURS / FAILURES
r_mission = math.exp(-(MISSION_MIN / 60) / mtbf)
print(f"MTBF {mtbf:.1f} h, reliability of one {MISSION_MIN}-min mission {r_mission:.3f}")
print(f"expected aborts in 100 missions: {100 * (1 - r_mission):.1f}")

for r_target, conf in ((0.95, 0.90), (0.95, 0.95), (0.99, 0.95)):
    n = math.ceil(math.log(1 - conf) / math.log(r_target))
    print(f"to show R >= {r_target} with {conf:.0%} confidence: {n} missions with zero failures")
print(f"30 missions with no failure -> failure rate below about {3 / 30:.0%} (rule of three)")
MTBF 21.0 h, reliability of one 20-min mission 0.984
expected aborts in 100 missions: 1.6
to show R >= 0.95 with 90% confidence: 45 missions with zero failures
to show R >= 0.95 with 95% confidence: 59 missions with zero failures
to show R >= 0.99 with 95% confidence: 299 missions with zero failures
30 missions with no failure -> failure rate below about 10% (rule of three)From the data so far, a 20-minute mission succeeds about 98% of the time. But demonstrating 95% with 90% confidence needs 45 missions without a single failure, which is beyond the project’s time, so the report must state the confidence level the data actually supports.
Is it easy to use?
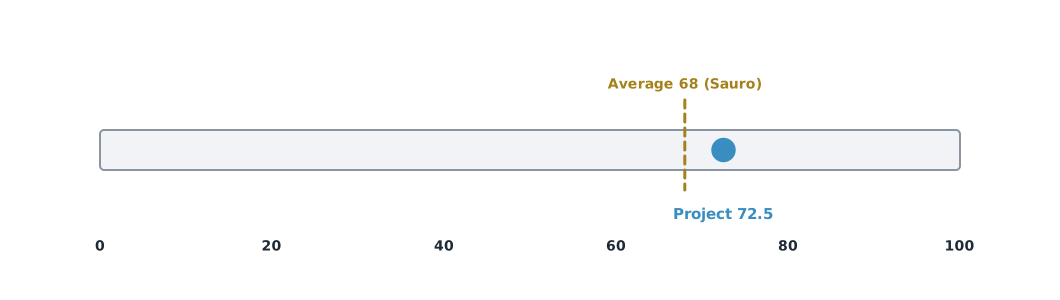
The System Usability Scale (SUS) by Brooke (1996) is a 10-item questionnaire on a 1–5 scale. Odd items score (response − 1), even items score (5 − response), and the sum is multiplied by 2.5 to give 0–100. Sauro (2011) reports an average of about 68 across 500 studies, and Bangor and colleagues (2008) give guidance for interpreting scores.
Example 2 SUS from five irrigation staff, and effectiveness
import statistics as st

responses = [                      # 10 items, scale 1–5
    [4, 2, 4, 2, 4, 1, 4, 2, 3, 2],
    [5, 1, 4, 2, 4, 2, 5, 1, 4, 3],
    [3, 2, 3, 3, 4, 2, 4, 2, 3, 2],
    [4, 2, 4, 1, 4, 2, 4, 2, 4, 2],
    [4, 3, 3, 2, 3, 2, 4, 3, 3, 2],
]

def sus(r):
    return 2.5 * sum((v - 1) if i % 2 == 0 else (5 - v) for i, v in enumerate(r))

scores = [sus(r) for r in responses]
print("SUS per user:", scores, f"mean {st.mean(scores):.1f}, lowest {min(scores)}")

manual = {"minutes per round": 180, "people": 2}
drone = {"minutes per round": 45, "people": 2}
saved = manual["minutes per round"] * manual["people"] - drone["minutes per round"] * drone["people"]
print(f"staff time saved per 2 km round: {saved} person-minutes ({saved / (manual['minutes per round'] * manual['people']):.0%})")
SUS per user: [75.0, 82.5, 65.0, 77.5, 62.5] mean 72.5, lowest 62.5
staff time saved per 2 km round: 270 person-minutes (75%)The mean is slightly above the reference average, but two users scored below 68, so interview them to find where they struggled. Five users is still a small sample, and the time saving must state that it excludes preparing flight permission documents and reviewing reports.
Reviewing risk after testing
Test results are new evidence that must feed back into the FMEA from UAT 493. For example, if GNSS dropouts near tall trees happen more often than expected, raise the occurrence score and add controls. Before operating the system for real outside the test area, assess it with an operational risk framework such as JARUS SORA and under the CAAT rules.
Module lab
Lab: post-test evaluation
- Total all test flight hours and failures and compute MTBF with Example 1
- Compute the number of rounds needed to demonstrate reliability, and write down the level the data actually supports
- Have at least five real users try the system, complete the SUS questionnaire and a short interview
- Measure time against the existing method systematically, including hidden time such as preparation and report review
- Review the FMEA with the test data and record what changed
Common mistakes
Watch out
- Claiming high reliability from a few tests
- Scoring SUS incorrectly by not reversing the even items
- Letting the development team answer SUS themselves
- Comparing effectiveness while leaving out time that does not favour the new system
- Not updating the FMEA with the test results
Summary
- MTBF = total time / number of failures, and R(t) = e^(−t/MTBF) when the failure rate is constant
- Demonstrating reliability needs many tests,
- SUS gives a 0–100 score compared with a reference average of about 68
- Evaluate effectiveness completely and feed test results back into the risk review
Check your understanding
- 30 flight hours with 3 failures. What is the MTBF?
- MTBF 20 hours and a 1-hour mission. What is the reliability?
- How many failure-free tests demonstrate R ≥ 0.90 at 90% confidence?
- What SUS score results if every item is answered 3?
- 60 tests with no failures. What is the approximate 95% upper bound on the failure rate?
Answers
- hours
- , so 22 tests
Key formulas
| MTBF and reliability | |
| Number of failure-free tests | |
| SUS score |
Key references
- NIST/SEMATECH. Exponential distribution (section 8.1.6.1). e-Handbook of statistical methods. link
- NIST/SEMATECH. Estimating the exponential parameter (section 8.4.5.1). e-Handbook of statistical methods. link
- Luko, S. N. (1997). Attribute reliability and the success run: A review (SAE Technical Paper 972753). SAE International. link
- Hanley, J. A., & Lippman-Hand, A. (1983). If nothing goes wrong, is everything all right? Interpreting zero numerators. JAMA, 249(13), 1743–1745. link
- Brooke, J. (1996). SUS: A 'quick and dirty' usability scale. In P. W. Jordan, B. Thomas, B. A. Weerdmeester, & I. L. McClelland (Eds.), Usability evaluation in industry (pp. 189–194). Taylor & Francis. link
- Brooke, J. (2013). SUS: A retrospective. Journal of Usability Studies, 8(2), 29–40. link
- Sauro, J. (2011, February 3). Measuring usability with the System Usability Scale (SUS). MeasuringU. link
- Bangor, A., Kortum, P. T., & Miller, J. T. (2008). An empirical evaluation of the System Usability Scale. International Journal of Human–Computer Interaction, 24(6), 574–594. link
- Joint Authorities for Rulemaking on Unmanned Systems. (2024). JARUS guidelines on Specific Operations Risk Assessment (SORA), main body, edition 2.5 (JAR-DEL-SRM-SORA-MB-2.5). link
Further reading
Study the assigned knowledge units in advance, review media and take the module quiz
In class / field
Team project work, advisor meetings and progress presentations
Learning evidence: Project milestone deliverables