ROS 2
UAT 308 Automation and Robotics Technology
Lesson
By the end of this module you will be able to
- Explain ROS 2 nodes, topics, services and actions and the role of DDS
- Choose QoS history, depth and reliability policies to suit each kind of data
- Analyse latency and dropped messages when a subscriber is slower than its publisher
- Pair messages from several sensors by time with a suitable slop
Why this matters
UAT 314 introduced ROS 2 concepts and the link to the flight controller through uXRCE-DDS and MAVROS. The drone knowledge base’s unit on ROS 2 and the flight stack link explains nodes, topics, services, actions and simulation, and its unit on moving from embedded systems to AI robots describes connecting cameras and sensor fusion on Edge AI hardware. Macenski et al. (2022) summarise that ROS 2 is built on DDS so that communication quality (QoS) can be set to suit the task. The most common lab problem is not writing nodes but data arriving late, incomplete or out of step, so this module focuses on setting QoS and pairing data by time.
Parts of ROS 2
A node is one program unit. A topic carries continuous many-to-many data, such as camera images and LiDAR scans. A service is a single request and reply, such as asking to switch on a work light. An action is for long-running tasks that report progress or can be cancelled, such as driving to panel row 12. Underneath ROS 2 is DDS, which discovers peers on the network without a central broker.
QoS policies
The ROS 2 documentation describes the main policies as follows. History keep last stores only the most recent N samples, set by depth; keep all stores every sample, subject to middleware resource limits. Reliability best effort attempts delivery but may lose samples on a poor network; reliable guarantees delivery and may retry several times. The default profile uses reliable, keep last, depth 10, while the sensor-data profile uses best effort, keep last, depth 5, because for camera images the latest data matters more than receiving every old image. Publishers and subscribers must use compatible QoS or they will not connect.
Example 1 A 30 Hz camera and a hotspot detector that takes 50 ms
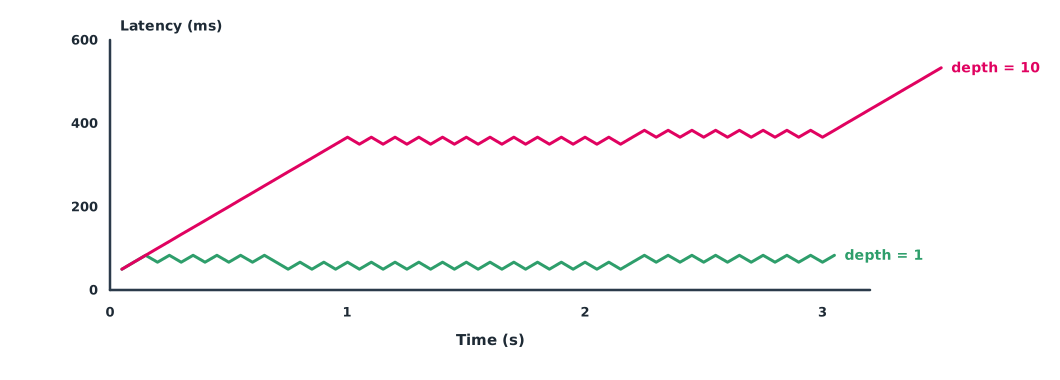
The thermal camera publishes at 30 Hz for 3 s. The hotspot detector processes each image in 50 ms (20 images per second). Compare keep last depth 1 with depth 10 (a simple queue model, ignoring network transfer time).
from collections import deque

PUB_HZ = 30          # camera publishes at 30 Hz
PROC = 0.050         # subscriber takes 50 ms per image
DURATION = 3.0

def run(depth):
    pubs = [k / PUB_HZ for k in range(int(DURATION * PUB_HZ))]
    q = deque()
    dropped, done, lat = 0, 0, []
    t_free = 0.0
    i = 0
    while i < len(pubs) or q:
        t_next = pubs[i] if i < len(pubs) else float("inf")
        if q and t_free <= t_next:
            stamp = q.popleft()
            start = max(t_free, stamp)
            lat.append(start + PROC - stamp)
            t_free = start + PROC
            done += 1
        else:
            if len(q) == depth:
                q.popleft()          # KEEP_LAST drops the oldest message
                dropped += 1
            q.append(t_next)
            i += 1
    lat.sort()
    return done, dropped, sum(lat) / len(lat), lat[len(lat) // 2]

for depth in [1, 10]:
    done, dropped, avg, med = run(depth)
    print(f"depth={depth:>2}  processed {done}  dropped {dropped}  "
          f"mean latency {avg*1000:.0f} ms  median {med*1000:.0f} ms")
depth= 1 processed 61 dropped 29 mean latency 66 ms median 67 ms
depth=10 processed 70 dropped 20 mean latency 334 ms median 367 msBecause the subscriber is slower than the publisher, some images must be dropped whatever the depth. The difference is that depth 10 makes the processed image an old one that waited in the queue about s plus processing time, so latency is almost 0.4 s, while depth 1 always gets the latest image with latency around 67 ms. At 1 m/s, that difference puts the hotspot position about 30 cm off. Short queues suit real-time control and detection; data that must be complete, such as event logs, should use reliable delivery and long queues.
Pairing data from several sensors by time
Fusing a camera with a LiDAR needs messages measured at nearly the same time. The ROS message_filters package provides ApproximateTimeSynchronizer, whose slop parameter, in seconds, sets how far apart messages may be and still be paired. The next example uses a simple method, finding the nearest image for each LiDAR scan, which is simpler than the package’s real algorithm but shows the effect of slop clearly.
Example 2 A 15 Hz camera and a 10 Hz LiDAR
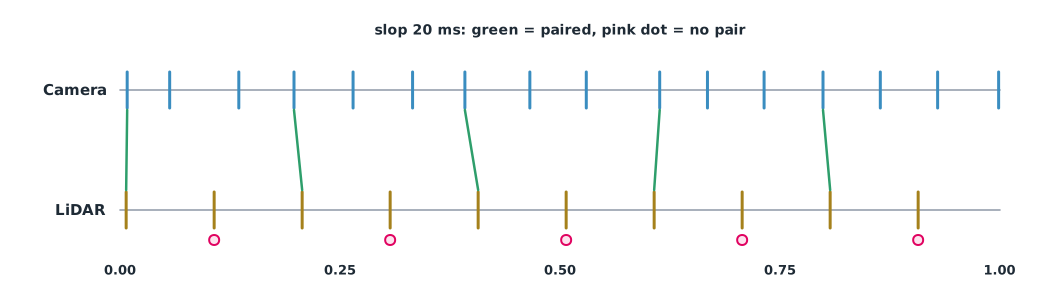
The camera publishes at 15 Hz with slight timing jitter; the LiDAR publishes at 10 Hz starting 7 ms later, over 2 s (simulated data).
import numpy as np

rng = np.random.default_rng(3)
cam = np.arange(0, 2.0, 1/15) + rng.normal(0, 0.004, 30)    # camera 15 Hz
lidar = np.arange(0.007, 2.0, 1/10)                          # LiDAR 10 Hz

def pair(slop):
    pairs = []
    for t in lidar:
        j = np.argmin(np.abs(cam - t))
        if abs(cam[j] - t) <= slop:
            pairs.append((t, cam[j]))
    return pairs

for slop in [0.005, 0.020, 0.040]:
    p = pair(slop)
    gaps = [abs(a - b) * 1000 for a, b in p]
    print(f"slop {slop*1000:>2.0f} ms  paired {len(p)}/{len(lidar)}  "
          f"largest gap {max(gaps):.1f} ms")
slop 5 ms paired 3/20 largest gap 3.2 ms
slop 20 ms paired 10/20 largest gap 15.1 ms
slop 40 ms paired 20/20 largest gap 34.1 msBecause 15 and 10 Hz do not divide evenly, half the LiDAR scans have no image within 20 ms. A small slop gives few but well-timed pairs; a large slop pairs everything, but some pairs are 34 ms apart. If the UGV is turning at 30 degrees per second, 34 ms equals about 1 degree of heading error. Better than widening the slop is to trigger the sensors together or choose rates that divide evenly.
Module lab
Lab: setting QoS and measuring real latency
- Write a node publishing images from the training camera at 30 Hz and a subscriber that delays 50 ms per image, with a timestamp on every message
- Measure images processed and latency with depth 1, 5 and 10, and compare with Example 1
- Set incompatible reliability on publisher and subscriber, observe what happens, and inspect QoS with
ros2 topic info --verbose - Record a bag of camera and LiDAR data and pair them with ApproximateTimeSynchronizer at different slops, counting pairs
- Summarise a QoS table for every topic on the UGV with reasons
Common mistakes
Watch out
- Using reliable delivery and a long queue for camera images, so processed images are stale
- Setting incompatible QoS on publisher and subscriber and thinking the code is broken
- Pairing on receive time instead of measurement time
- Widening slop until data far apart in time is paired
- Not measuring real end-to-end latency from sensor to result
Summary
- ROS 2 is built on DDS, with topics, services and actions for different kinds of work
- QoS sets history, depth and reliability to suit each kind of data
- A subscriber slower than its publisher must drop data; long queues add latency
- Time pairing needs a carefully chosen slop, and it is best to have sensors measure together
Check your understanding
- Which kind of task should use an action rather than a service?
- What does keep last depth 5 mean?
- With a 30 Hz publisher and a full depth-10 queue, about how long has the oldest image waited?
- Why does the sensor-data profile use best effort?
- If the UGV turns at 30 degrees per second and a data pair is 20 ms apart, what is the heading error?
Answers
- A long-running task that reports progress or can be cancelled, such as driving to a position
- Only the 5 most recent messages are kept; older ones are dropped
- About s
- The latest data matters more than receiving all old data, and retries add delay
Key formulas
| Age of the oldest message in a full queue | |
| Time pairing condition |
Key references
- Open Robotics. ROS 2 documentation. link
- Macenski, S., Foote, T., Gerkey, B., Lalancette, C., & Woodall, W. (2022). Robot Operating System 2: Design, architecture, and uses in the wild. Science Robotics, 7(66), eabm6074. link
- Open Robotics. Quality of Service settings. ROS 2 documentation (Jazzy). link
- Open Robotics. Approximate synchronizer (Python). message_filters documentation (ROS 2 Jazzy). link
Further reading
Study the assigned knowledge units in advance, review media and take the module quiz
ROS 2 and flight-stack integration
Deep dive: from embedded systems to AI robots and ROS
In class / field
Lab or field practice from worksheets with a safety checklist
Learning evidence: Checked worksheets and quiz results