Accuracy and delivery
UAT 361 Unmanned Aircraft Systems Technology for Surveying, Mapping and Inspection
Lesson
By the end of this module you will be able to
- Compute bias and horizontal and vertical RMSE from independent checkpoints
- Report accuracy under ASPRS Edition 2 Version 2, including the checkpoint survey error
- Trace causes from error patterns and check the completeness of the area
- Assemble a delivery package with a SHA-256 manifest and make a three-state acceptance decision
Why this matters
Map users always ask “how far can I trust it?” A good answer is not “very sharp” or “we used RTK”, but a number from independent checkpoints, computed to a standard, together with the area it covers and its limits. The other half is a delivery package that the recipient can open and check without phoning the surveyor. Without these two, however good the images look, the job is not a deliverable survey.
Bias and RMSE
For each checkpoint the error = map value − surveyed value, computed separately for E, N and Z.
- Bias (): the mean error, showing systematic shift
- RMSE (root mean square error): the square root of the mean of the squares, showing the total size of the error, both systematic and random
Zero bias does not mean accurate, because positive and negative errors can cancel. RMSE is not a standard deviation; do not use a spreadsheet’s standard deviation function instead, because that hides the bias.
Reporting under ASPRS Edition 2
The ASPRS Positional Accuracy Standards, Edition 2 Version 2 (2024), contain points every drone surveyor must know, as summarised by Abdullah (2025):
- Accuracy is reported as horizontal RMSE (RMSE) and vertical RMSE (RMSE); the 95% confidence level is no longer used
- At least 30 checkpoints are required for projects up to 1,000 km². With fewer, as in many small drone jobs, the report must state that only that number of checkpoints was tested
- Checkpoints should be at least twice as accurate as the product being tested
- The checkpoint survey error must be included: , where RMSE comes from comparing the product with the checkpoints and RMSE is the accuracy of the checkpoint survey itself
Example 1. Accuracy from four checkpoints
Synthetic training data. The checkpoint survey accuracy is assumed to be 2 cm horizontal and 3 cm vertical.
import math

errors = {  # id: (eE, eN, eZ) m = map − surveyed
    "A": (0.03, 0.04, 0.10), "B": (-0.03, 0.04, 0.00),
    "C": (0.00, -0.05, -0.10), "D": (0.00, 0.05, 0.00),
}
SURVEY_H, SURVEY_V = 0.02, 0.03
n = len(errors)
rms = lambda values: math.sqrt(sum(v * v for v in values) / n)

e_e, e_n, e_z = zip(*errors.values())
rmse_h1 = math.hypot(rms(e_e), rms(e_n))
rmse_v1 = rms(e_z)
print(f"bias E {sum(e_e) / n:+.3f}  N {sum(e_n) / n:+.3f}  Z {sum(e_z) / n:+.3f} m")
print(f"product vs checkpoints: RMSE_H {rmse_h1:.3f} m, RMSE_V {rmse_v1:.3f} m")
print(f"including checkpoint survey: RMSE_H {math.hypot(rmse_h1, SURVEY_H):.3f} m, "
      f"RMSE_V {math.hypot(rmse_v1, SURVEY_V):.3f} m")
if n < 30:
    print(f"report as tested with ONLY {n} checkpoints (fewer than 30)")
bias E +0.000 N +0.020 Z +0.000 m
product vs checkpoints: RMSE_H 0.050 m, RMSE_V 0.071 m
including checkpoint survey: RMSE_H 0.054 m, RMSE_V 0.077 m
report as tested with ONLY 4 checkpoints (fewer than 30)The vertical bias is zero, yet the vertical RMSE is about 7 cm, because some points are 10 cm too high and others 10 cm too low. Including the checkpoint error raises the reported numbers slightly, which is more honest. With only 4 points, the report must say clearly that only 4 checkpoints were tested.
Tracing causes from error patterns
| Finding | Hypothesis to check | How to separate causes |
|---|---|---|
| All points shift the same way | Datum, coordinate system or image position correction | Compare metadata and raw coordinates before any transformation |
| Horizontal fine, Z shifted by a constant | Height system or pole height | Check ellipsoidal versus orthometric heights (module 2) |
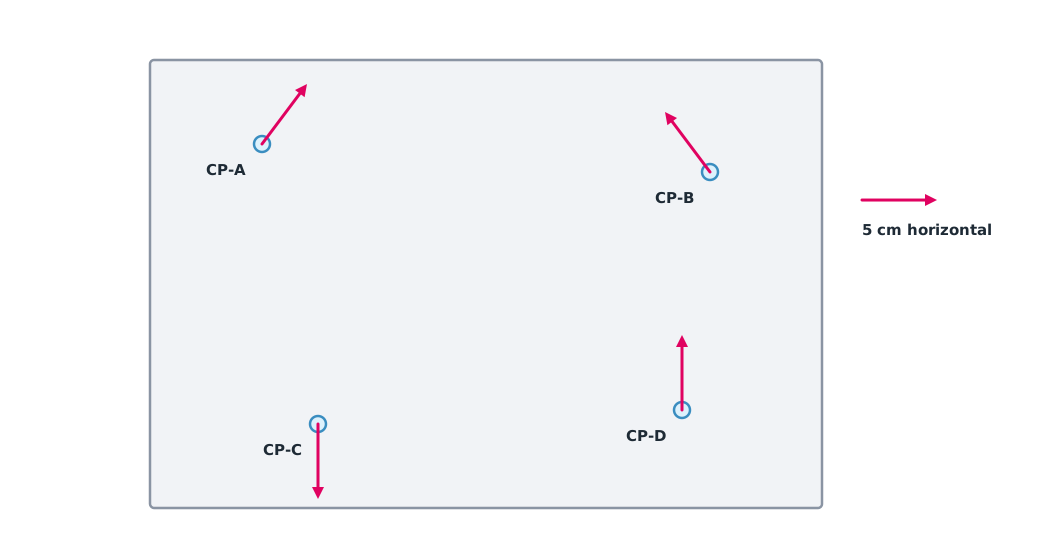
| Error grows away from the centre | Distribution of images or GCPs | View camera, GCP and checkpoint positions together |
| A few points stand out | Wrong marking, or comparing different surfaces | Check that point’s images before deciding |
Never delete a checkpoint just because it makes the RMSE look better. If a point really is wrong, give the reason and report results both before and after removing it.
Completeness and the delivery package
Completeness compares the area with usable data against the area that must be delivered, not the rectangular frame of the image file. If the 240 × 160 m yard has 36,480 m² of usable data, completeness is 95%, but the missing 5% might be the most important part, so show on a map where it is missing.
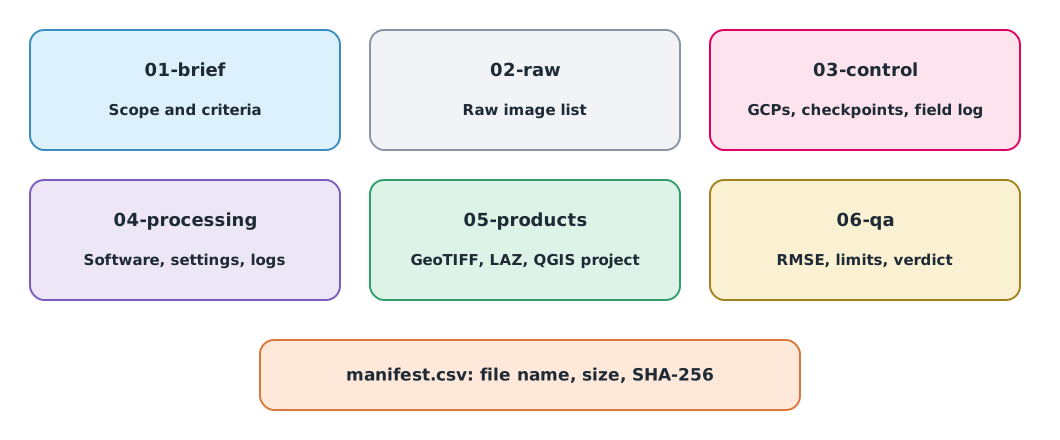
A manifest lists every file with its size and SHA-256 value (the hash function of FIPS 180-4). The recipient recomputes the values to confirm that files are complete and unchanged. But SHA-256 only shows that a file has not changed; it does not show that the coordinates are correct.
Example 2. Building a manifest and checking completeness
import hashlib

files = {  # file name: content (short stand-ins for real files)
    "01-brief/brief.md": b"Yard survey 240 x 160 m, EPSG:32647, orthometric height",
    "03-control/points.csv": b"id,role,E,N,H\nG1,control,500.00,1000.00,80.430\n",
    "06-qa/qa_report.md": b"RMSE_H 0.054 m, RMSE_V 0.077 m, ONLY 4 checkpoints",
}
for name, data in files.items():
    print(f"{name:<24} {len(data):>3} B  {hashlib.sha256(data).hexdigest()[:16]}...")

required, valid = 240 * 160, 36_480
print(f"coverage {valid / required:.0%} of {required:,} m2")
01-brief/brief.md 55 B 15e94383f7b44355...
03-control/points.csv 47 B 98ffe3c8ec044706...
06-qa/qa_report.md 50 B 04b86c732b8a4bf4...
coverage 95% of 38,400 m2The hashes are cut to 16 characters for readability; a real manifest must keep all 64.
Three-state acceptance
- Pass: the evidence meets all criteria agreed in the brief, and the person responsible for checking accepts it
- Fail: results clearly show which requirement is not met, with a fix or plan to collect again
- Insufficient evidence: checkpoints, the reference system or other data needed for a decision are missing. Never report this as a pass
Module lab
Lab: quality report and delivery
- Read checkpoint coordinates from the module 3 products, compute bias and RMSE with Example 1, and check one row by hand
- Load the checkpoints into QGIS, show the error arrows, check the pattern against the table and write hypotheses for the causes
- Draw the boundary of usable data, compute completeness and identify missing areas
- Organise the package as in Figure 2 and create a SHA-256 manifest of every real file
- Hand the package to another team to open without asking questions; they recompute one checkpoint and make a three-state acceptance decision with reasons
Common mistakes
Watch out
- Using standard deviation instead of RMSE, hiding the bias
- Reporting GCP errors instead of checkpoint errors
- Leaving out the checkpoint survey error, or not stating that there were fewer than 30 checkpoints
- Deleting a checkpoint with a large error without evidence
- Believing SHA-256 proves the coordinates are correct
Summary
- Bias shows systematic shift and RMSE the total size of the error; report both from independent checkpoints
- ASPRS Ed. 2 V2 uses RMSE including checkpoint error and requires at least 30 checkpoints, or a statement when there are fewer
- Error patterns point to causes, and completeness must be shown on a map
- The delivery package has a clear structure and a SHA-256 manifest, and acceptance is pass, fail or insufficient evidence
Check your understanding
- Errors on one axis are +0.06 and 0.00 m. What are the bias and RMSE?
- RMSE = 0.03 m and RMSE = 0.04 m. What is RMSE?
- Compared with checkpoints, RMSE = 0.06 m, and the checkpoints were surveyed to 0.02 m. What value is reported?
- 9,120 m² of usable data out of 9,600 m² required. What is the completeness?
- Which state applies to a job where no checkpoints were ever measured?
Answers
- Bias m, RMSE m
- m
- m
- Insufficient evidence
Key formulas
| Bias and RMSE per axis | |
| Horizontal RMSE | |
| Including checkpoint error (ASPRS Ed. 2) | |
| Area completeness |
Key references
- American Society for Photogrammetry and Remote Sensing. (2024). ASPRS positional accuracy standards for digital geospatial data (Edition 2, Version 2). link
- Abdullah, Q. (2025). Overview of the ASPRS positional accuracy standards for digital geospatial data, Edition 2, Version 2 (2024). Photogrammetric Engineering & Remote Sensing, 91(5), 247–255. link
- OpenDroneMap Authors. Ground control points. OpenDroneMap documentation (Version 3.5). link
- NIST/SEMATECH. e-Handbook of statistical methods. National Institute of Standards and Technology. link
- National Institute of Standards and Technology. (2015). Secure hash standard (SHS) (FIPS 180-4). link
- Sampath, A., Shrestha, M., While, M., & Scholl, V. M. (2023). Guidelines for calibration of uncrewed aircraft systems imagery (Open-File Report 2023–1033). U.S. Geological Survey. link
Further reading
Study the assigned knowledge units in advance, review media and take the module quiz
Checking accuracy and troubleshooting maps
Accepting and packaging deliverables
Three end-to-end survey training missions
Instructor guide: surveying and mapping
In class / field
Intensive lab and field practice recorded in a lab notebook
Learning evidence: Lab notebook signed by the instructor