Datasets and evaluation
UAT 315 Artificial Intelligence, Data Analytics and Computer Vision for Unmanned Aircraft Systems
Lesson
By the end of this module you will be able to
- Explain data leakage when frames from one flight appear in both training and test sets, and split by group with GroupShuffleSplit
- Calculate the confusion matrix, precision, recall, F1 and IoU, and read them in the context of the task
- Explain the difference between COCO mAP50 and mAP50–95
- Choose a confidence threshold by the harm of each error, and write a data card
Why this matters
A team reports that its victim-detection model is 99% accurate, yet flying over an unfamiliar forest, the system misses almost everyone. The cause is not the model but how the data was split and how results were measured. A flawed evaluation misleads the whole team and can lead commanders to deploy a system that is not ready. The drone knowledge hub’s units on checking a dataset before training AI and on image quality and AI metrics underpin this module.
Leakage from frames of the same flight
Frames from the same flight are very alike. Split randomly by frame, and near-identical frames end up in both training and test sets; the model scores well by recognising the scene, not by learning what we want. This is data leakage. The fix is to split by group, keeping each flight in one set. If the model must work in new areas, split by area as well.
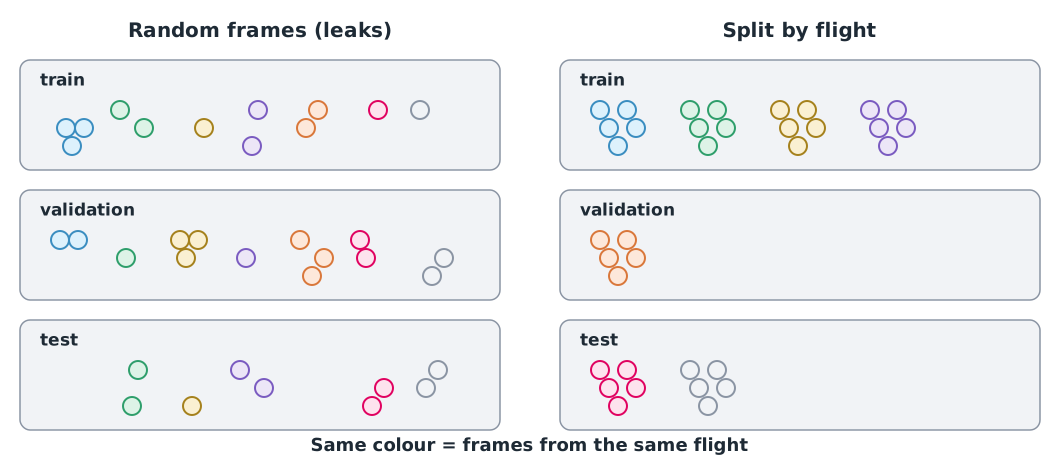
Example 1 Inflated scores from a random split
Synthetic data from 40 flights of 30 frames each. Each flight has its own scene “signature”, and the whole flight shares one label, with only a weak real signal related to the label. The model is a 1-nearest-neighbour (1-NN) classifier, which predicts from the most similar training example.
import numpy as np
from sklearn.model_selection import GroupShuffleSplit, train_test_split
from sklearn.neighbors import KNeighborsClassifier
from sklearn.metrics import accuracy_score

rng = np.random.default_rng(345)
flights, frames = 40, 30
signature = rng.normal(0, 1, (flights, 5))
flight_label = rng.integers(0, 2, flights)
X = np.repeat(signature, frames, axis=0) + rng.normal(0, 0.1, (flights * frames, 5))
X[:, 0] += 0.3 * np.repeat(flight_label, frames)
y = np.repeat(flight_label, frames)
groups = np.repeat(np.arange(flights), frames)

knn = KNeighborsClassifier(n_neighbors=1)
X_tr, X_te, y_tr, y_te = train_test_split(X, y, test_size=0.25, random_state=0)
print(f"random split by frame:  accuracy {accuracy_score(y_te, knn.fit(X_tr, y_tr).predict(X_te)):.3f}")
train_idx, test_idx = next(GroupShuffleSplit(test_size=0.25, random_state=0).split(X, y, groups))
print(f"split by flight:        accuracy {accuracy_score(y[test_idx], knn.fit(X[train_idx], y[train_idx]).predict(X[test_idx])):.3f}")
print("flights shared between train and test:", len(set(groups[train_idx]) & set(groups[test_idx])))
random split by frame: accuracy 1.000
split by flight: accuracy 0.300
flights shared between train and test: 0The random split scores 100% because every test frame has a twin from the same flight in the training set. Split by flight, the score falls to just 30%, no better than guessing in a two-class problem (with only 10 test flights, this figure swings a lot). The second figure is the real ability on new flights, which here is almost none.
The confusion matrix and metrics
A confusion matrix counts four outcomes: TP (present, and the system says present), FP (absent but flagged, a false alarm), FN (present but missed) and TN (absent, and the system says absent). From these we compute:
- Precision: of what the system flagged, how much was right
- Recall: of what was really there, how much the system found
- F1: the harmonic mean of the two
This example uses the counts from the drone knowledge hub’s unit on computer vision and edge AI: TP = 8, FP = 2, FN = 4.
from sklearn.metrics import confusion_matrix, precision_recall_fscore_support

y_true = np.array([1] * 12 + [0] * 8)
y_pred = np.array([1] * 8 + [0] * 4 + [1] * 2 + [0] * 6)
tn, fp, fn, tp = confusion_matrix(y_true, y_pred).ravel()
p, r, f1, _ = precision_recall_fscore_support(y_true, y_pred, average="binary")
print(f"TP {tp}  FP {fp}  FN {fn}  TN {tn}")
print(f"precision {p:.4f}  recall {r:.4f}  F1 {f1:.4f}")
TP 8 FP 2 FN 4 TN 6
precision 0.8000 recall 0.6667 F1 0.7273In a search for victims, a recall of 0.67 means missing one person in three, which is far worse than a false alarm that sends someone to check. A model’s confidence score is not accuracy either: a score of 0.9 on one image does not mean the model is right 90% of the time on all images.
IoU and mAP
In object detection, predicted boxes must first be matched one-to-one with true boxes, and a match only counts as TP when its IoU reaches the threshold. Two boxes on the same object count as only one TP.
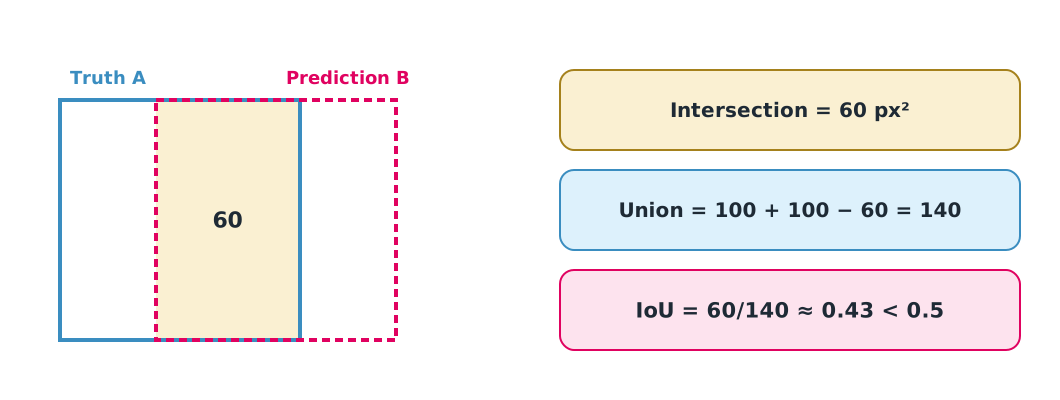
AP (average precision) summarises how precision and recall trade off as the confidence threshold changes, and mAP averages AP over classes. COCO evaluation uses AP averaged over IoU thresholds from 0.50 to 0.95 in steps of 0.05 as its primary metric, while AP50 uses a single IoU of 0.50, which is much more lenient. The two numbers cannot be compared directly.
iou_thresholds = np.round(np.arange(0.50, 0.96, 0.05), 2)
print("COCO IoU thresholds:", iou_thresholds.tolist(), "count", len(iou_thresholds))
ap_per_class = {"person": 0.6, "vehicle": 0.8}
print("mAP =", round(sum(ap_per_class.values()) / len(ap_per_class), 2))
COCO IoU thresholds: [0.5, 0.55, 0.6, 0.65, 0.7, 0.75, 0.8, 0.85, 0.9, 0.95] count 10
mAP = 0.7The per-class AP values are hypothetical figures from the knowledge hub. AP cannot be computed from counts at a single threshold; it needs an evaluator that ranks every confidence score. When reporting, name the metric precisely, such as “mAP50–95 on a test set split by area”.
Choosing a threshold by harm
scores = np.array([0.95, 0.91, 0.88, 0.84, 0.80, 0.74, 0.69, 0.62, 0.55, 0.48,
                   0.44, 0.39, 0.33, 0.28, 0.22, 0.18, 0.12, 0.09, 0.05, 0.03])
labels = np.array([1, 1, 1, 0, 1, 1, 0, 1, 1, 0, 1, 0, 1, 0, 0, 1, 0, 0, 0, 0])
for threshold in (0.7, 0.5, 0.3):
    pred = (scores >= threshold).astype(int)
    p, r, f1, _ = precision_recall_fscore_support(labels, pred, average="binary")
    print(f"threshold {threshold}: alerts {pred.sum():>2}  precision {p:.2f}  recall {r:.2f}  F1 {f1:.2f}")
threshold 0.7: alerts 6 precision 0.83 recall 0.50 F1 0.62
threshold 0.5: alerts 9 precision 0.78 recall 0.70 F1 0.74
threshold 0.3: alerts 13 precision 0.69 recall 0.90 F1 0.78A lower threshold finds more real objects but raises more false alarms. No threshold is best for every task: choose it from the harm of each kind of error and how many alerts people can check, and choose it on the validation set, not the test set.
Data card
A data card documents a dataset: the source and usage rights of the images, how they were collected and labelled, the definition of each class, how the data was split and by what unit, the number of examples per class, the conditions covered and not covered (for example, no night images), and known limits. Anyone using the model should be able to see which situations its results apply to.
Class activity
Activity: auditing a model report
- The instructor hands out a mock report claiming “98% accuracy”. Each group lists at least five questions to ask before believing it, such as how the data was split, which metric was used and where the test set came from.
- Do the drone knowledge hub’s exercise on checking a dataset before training AI: find the five kinds of error in the manifest before running the checking program.
- For a victim search and for tree counting, choose a threshold from the table in this lesson, with reasons.
- Write a one-page data card for an image set your group might collect in future.
Common mistakes
Watch out
- Splitting randomly by frame when frames come from the same flight or area
- Reporting accuracy alone in detection tasks where real objects are rare
- Comparing mAP50 with mAP50–95 as if they were the same number
- Choosing the confidence threshold on the test set
- Having no data card, so users never learn the model has not seen night images or other areas
Summary
- Frames from one flight must stay in one set, or scores will be inflated
- Precision, recall and F1 answer different questions; choose metrics by the harm of each error
- Detection matches boxes with IoU, and mAP50 and mAP50–95 are different metrics
- Choose thresholds on the validation set, and document data with a data card
Check your understanding
- With TP = 30, FP = 10 and FN = 20, what are precision and recall?
- If FP drops to 0 while TP = 8 and FN = 4, what is F1?
- Why does a random split by frame give inflated scores?
- How many IoU levels does COCO mAP50–95 average over?
- Which task should favour recall over precision: “search for victims” or “choose good-looking images for publicity”?
Answers
- Precision and recall
- Near-identical frames from the same flight land in both training and test sets, so the model recognises the scene
- Ten levels: 0.50, 0.55, …, 0.95
- Searching for victims, because missing a person who needs help is far worse than a false alarm
Key formulas
| Precision | |
| Recall | |
| F1 | |
| mAP |
Key references
- scikit-learn developers. Cross-validation: Evaluating estimator performance (scikit-learn 1.9). link
- scikit-learn developers. Metrics and scoring: Quantifying the quality of predictions (scikit-learn 1.9). link
- COCO Consortium. Detection evaluation. Common Objects in Context. link
- Ultralytics. Models supported by Ultralytics (YOLO11, YOLO26). Ultralytics documentation. link
- Géron, A. (2025). Hands-on machine learning with Scikit-Learn and PyTorch. O'Reilly. link
- National Institute of Standards and Technology. (2023). Artificial intelligence risk management framework (AI RMF 1.0) (NIST AI 100-1). link
Further reading
Study the assigned knowledge units in advance, review media and take the module quiz
Checking datasets before AI training
Checking image quality and reading AI metrics
Preparing and splitting datasets
Training and evaluating object detection
In class / field
Lecture, case discussion and in-class problem solving
Learning evidence: Quiz results and submitted exercises